|
Media Use Statistics Resources on media habits of children, youth and adults |
Streaming Statistics (Source)
- About 60% of young adults in the US primarily use online streaming to watch TV [1]
- The number of Americans who watch television via cable or satellite has plummeted from 76% in 2015 to 56% in 2021 [2]
- U.S. adults now spend nearly 6 hours per day watching video. The span (5:57) represents an 11-minute increase in video consumption, with 6 of those 11 minutes from TV-connected devices [3]
- 83% of US households in 2023 used a paid subscription video service like Netflix or Hulu [4]
- As of 2024, 50% of consumers who watch online video use a free or paid ad-supported streaming service [5]
- Millennials remain the largest segment of CTV users (62 million), while Gen Z trails closely behind (52.8 million). Additionally, 51.6 million Gen X and 35.8 million Baby Boomers use CTV. [6]
- Consumers are 39% more likely to share content if it’s delivered through video [7]
- While video can help convert customers already on a path to purchase, it also enables a retailer’s existing customers to bring friends and family into the fold — 48% of consumers have shared a brand video on their social media profile [7]
- Nearly 80% of marketers recognize video (including TV, digital video, social video, and OTT video) as an increasingly important medium [8]
- Video could make up as much as 90% of all 5G traffic [9]
- 29% of consumers would pay a premium if 5G provided “better quality video” on mobile devices and “decreased buffering while streaming video” [10]
- Interactive video ads encourage consumers to spend 47% more time engaging with an ad on average and make the ad 32% more memorable [11]
- Consumers have a low tolerance for a bad stream. For many, 90 seconds is the most a viewer will tolerate a spotty stream [12]
- Streaming accounts for 26% of all time spent on TV [13]
- Annual CTV ad spend in the US is expected to reach $36 billion in 2026. [14]
- 68% of the US population (233 million people) uses a connected TV [15]
- 54% of US internet users subscribe to four or more over-the-top (OTT) video services, while 20% subscribing to 8 or more services. [16]
- In Q4 2023, TVs accounted for 58% of spending for streaming video ad inventory purchased through traditional buys. Phones and tablets account for another 32% of spending, while desktops and laptops accounted for the remaining 10% [17]
- Ad spend for streaming platforms like Hulu, Netflix, and Max rose by 10% year over year in Q4 2023. [17]
- For streaming ad inventory purchased through real-time bidding, mobile devices accounted for a majority of spending in Q4 2023, while television accounting for 27% and computers accounting for 22% [17]
- In 2024, brands spent $30.10 billion on streaming advertisements, compared to $60.56 billion on traditional TV ads [18]
- There are approximately 115 million CTV households in the United States [19]
——————————————————————————————————–
Screen Time Statistics (Source)
- People spent more than 6 hours online as of 2023.
- Over 47% of Americans visit the net numerous times daily, while 31% are online regularly.
- In 2023, Americans spent more than 7 hours on screens.
- American adults spend 1 hour /27 minutes on video games (every day) in 2023.
- Wealthy Adolescents watched less TV (2 hours /3 minutes less) than young adults from poorer families.
- Research shows that 34% of an American’s screen time is spent on TVs.
- Generally, people spend over 53% of their screen time on smartphones.
- People spend more than 3 hours on computer screens globally.
- Americans spent over 2 hours / 10 minutes on Hulu.
- Kids aged 2 to 4 have an average screen time of 2 hours and 30 minutes.
1. Globally, social media users spend over 2 hours and 27 minutes daily, which has increased solely in 2023.
2. Over 60% of American parents limit their kid’s screen time, whereas 40% don’t in 2022.
3. The scientifically recommended screen time has surpassed 87% globally (especially with children).
4. 1n 2021, the average time for screens rose to 7 hours and 7 minutes due to the COVID-19 Pandemic.
5. Also, a 52% rise in kid’s screen time during COVID-19.
6. Over 84% of American adults utilize the Internet daily.
7. More than 47% of Americans visit the net regularly daily, while 31% stay active online. Additionally, just 6% of Americans go online occasionally, and 7% always go offline.
8. In the United States, the average time spent gaming daily is 1 hour and 10 minutes. South Africa, on the other hand, spends 3 hours and 43 minutes gaming.
9. Furthermore, the Philippines spends an average of 4 hours 6 minutes, Brazil 3 hours 41 minutes, Colombia 3 hours 46 minutes, and Malaysia 3 hours 3 minutes daily playing video games.
=================================================================
More than three-quarters (77%) of Americans tune into broadcast radio or television stations at least a few times a week to stay informed, while nearly half use TV or radio multiple times a day, a Free Press survey indicates. (source)

Facts About Americans & TikTok (Source)

There are more social media users than there were people in 1971 (source)
Source: https://www.vox.com/recode/2020/1/6/21048116/tech-companies-time-well-spent-mobile-phone-usage-data
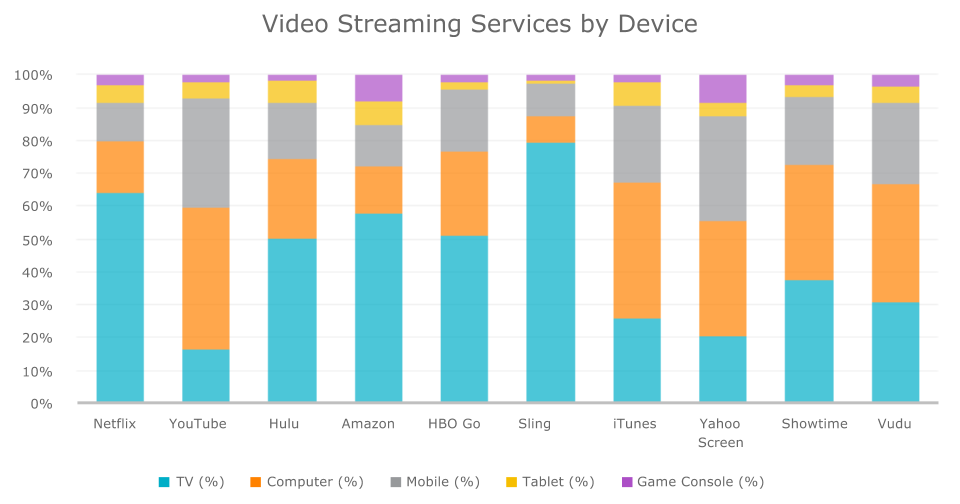
Streaming Content Soars, TV Sets Remain Top Device
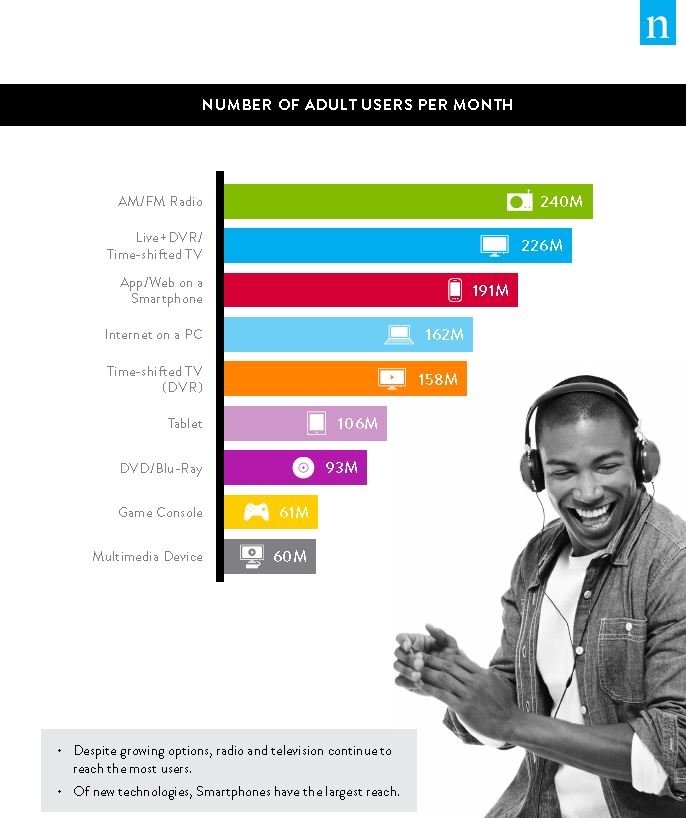
Radio Tops List of Adult Users Per Month

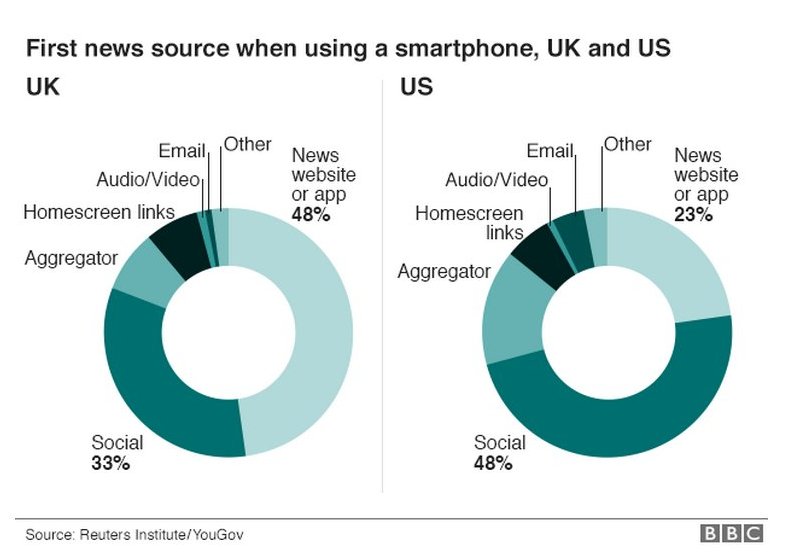
Social media outstrips TV as news source for young people
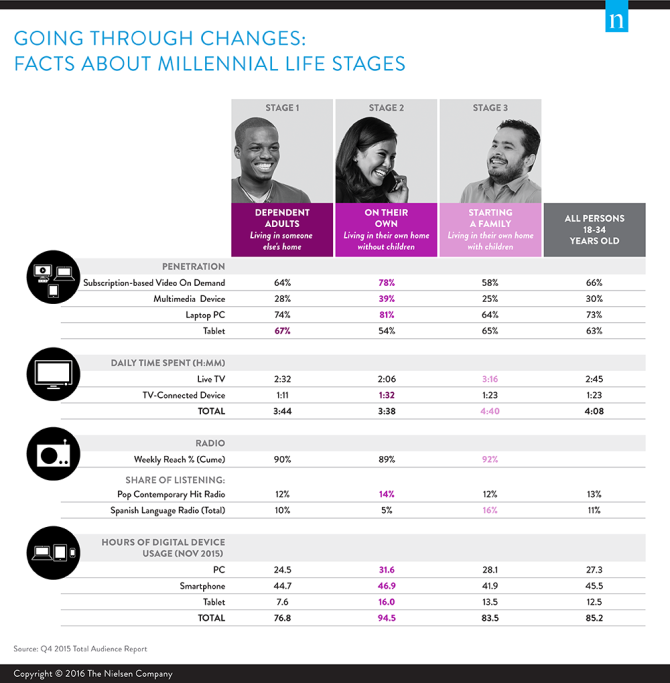
Millennials’ Media Habits Vary By Stage In Life (study)
Watching Less TV? Nielsen Says Smartphones & The Web Are The Reason
Source
State of the User Experience, 2015 (Limelight)

Common Sense Media Report: Teens Use Media 9 Hours Per Day (November 2015)
 |
 |
Source: SKIRT Magazine, October 2015

Millennials Are On Instagram, Their Parents Play Words With Friends And Everyone Is On Facebook


2/3 US Teens prefer to Surf Web While Watching TV
According to a new study by Nielsen charting the burgeoning influence of
social media on TV viewing habits, a quarter of viewers reported that they
were more aware of TV programs due to their social media interactions in a
year-over-year comparison from 2012 to 2013.In 2013, 15% of viewers said
they enjoyed watching television more when social media was involved. And
when it comes to viewing content, 11% of viewers said they watched more live
TV, and 12% said they recorded more programs in 2013 alone. In addition,
data from Nielsen’s first-quarter 2014 Cross Platform Report shows that the
average adult aged 18 and over now watches 5 hours and 10 minutes of live TV
and 34 minutes of time-shifted TV per day

Source

Source
Millennials Spend 14.5 Hours Per Week on
Smartphones

New Study Tracks Americans News Habits
“Americans
on average reported that, during the past week, they followed the news using
four different devices or technologies,” it said.
 (source)
 (Source)
Half of Americans Own An E-Reader (Pew
research)


Nickelodeon
Introduces
“The Story of Me” Research Study, Providing Inside Look At Today’s
Emerging Generation Of Kids (November 2013)
MEDIA AND TECHNOLOGY — USE*: Kids
today are being entertained on multiple devices, but TV still rules, and its
importance is growing.
    --  Media consumption among kids has grown over the past four years to

        nearly 35 hours per week, presenting an increase of 2.2 hours since

        2009.

    --  TV usage is up 12% versus nine years ago, according to Nielsen, despite

        the many alternative devices available to them including tablets,

        computers and games consoles.

    --  Computer and gaming consoles make 27% of kids' daily media consumption.

    --  While tablet adoption rates have increased, their adoption still

        represents a small slice of the pie, at 8%.

    --  Though computer and smartphone usage is up among kids, gaming is their

        number-one activity across devices. 96% of kids say they use their

        computer for gaming, compared to 88% on the tablet and 86% on the

        smartphone.

    --  Three-quarters of kids say they watch short form video on their iDevice,

        and consuming long-form programming is growing: more than half of kids

        with an iDevice now watch long-form content, a 23% lift over last year.    (Source)
Half of all babies use a computer or
smartphone before age 2 (story,
graphics from Common Sense Media)


Smartphone Ownership Grows
Source
 Source: http://www.entrepreneur.com/article/228029
Email Is Top Activity On
Smartphones, Ahead Of Web Browsing & Facebook [Study]

Here’s a handy chart from Nielsen,
breaking down the amount of time we spend in front of various screens each
month:

TV Still Tops, But Multiscreen
Viewing Commonplace
A majority of U.S. consumers — 60%
— still want to watch their shows on TV, but these same consumers also want
their smartphones and tablets by their side.
Drilling down to other data, KPMG International said in a new report that in
the U.S., 42% of consumers say they watch TV and access the Internet via a
laptop or PC, while 17% watch TV and access the Web via a smartphone. The
study also found that 22% watch TV and use a social networking site at the
same time. (Source)
Nielsen’s 2012 Social Media Report

on social networking sites rose 37 percent to 121 billion minutes in the
last year.

Twitter users tweeted about TV-related content.
Source
The Hours We Spend On Facebook,
Tumblr, Pinterest & Social Media


Source for all above:
http://marketingland.com/infographic-hours-facebook-tumblr-pinterest-social-media-27473
Social Media & American Politics (Pew Study)

Source
http://www.cbronline.com/blogs/cbr-rolling-blog/social-media-and-american-politics-study-221012
Nobody Goes Online Anymore?

Pew: After email, getting news is the most popular activity on smartphones,
tablets
 (
(


(Source:
WaPost)
Social Nets Eat Up Americans Online Time
A new survey shows
that Americans are increasingly transfixed with
social networking sites, with Facebook grabbing more
of our time than any other blog or social media.
Social networks and
blogs are taking up more and more of Americans time
online, now accounting for nearly a quarter of our
time spent on the Internet, according Nielsen’s
social media report. Internet users in the U.S.
spend more than twice as much time on social
networks than they do in the second-most popular
category: playing online games.
Facebook is the top
destination of all social networks and blogs.
Nielsen reported that 140 million people visited
Facebook in May. That’s 70% of all active U.S.
Internet users. Google’s Blogger came in second with
a distant 50 million visitors that month, while
Twitter was in the third spot with 23 million.

Source:
Computer World
The New Multi-Screen World: Understanding
Cross-platform Consumer Behavior

Source

Ericsson study: TV viewing
increasingly accompanied by use of social media
-
62
percent use social media while watching TV – an 18
percent point increase in one year -
67
percent use tablets, smartphones or laptops for TV
viewing -
60
percent use on-demand services on a weekly basis
(Source)
Teen
Use of Social Media
Nine out of ten 13- to
17-year-olds have used some form of social media. Three out of four
teenagers currently have a profile on a social networking site, and one in
five has a current Twitter account. 68% of all teens say Facebook is their
main social networking site, compared to 6% for Twitter, 1% for GooglePlus,
and 1% for MySpace.
For the vast
majority of teens, social and other digital communications media are a
daily part of life. 68% of teens text every day, 51% visit social networking
sites daily, and 11% send or receive tweets at least once every day. In
fact, 34% of teens visit their main social networking site several times a
day. 23% of teens is a “heavy” social media user, meaning they use at least
two different types of social media each and every day
More
here.
70%
Of Consumers Now Watch TV On Non-TV Devices; PCs Reign Supreme
The researchers say that TV consumption on tablets has more than
doubled in the last year in the 14 markets that it surveys, and 70 percent
of consumers now say they watch video on devices other than TVs. The device
leading the charge — or change, as the case may be? PCs; tablets still
accounting for less than 15 percent of TV consumption. TV, meanwhile, still
ranks as the single most-used device for watching television, accounting for
the other 30 percent of TV viewing. (Source)
Who Uses Mobile Devices? According to the 2012 RJI Mobile Media News Consumption Survey, two-thirds of U.S. adults used at least one mobile media device in their daily lives during the first quarter of 2012. Smartphones and large media tablets are now the preferred mobile media devices. In the two years since Apple defined the large media tablet market with its iPad, nearly a third of all adult mobile device owners in the U.S. said they are using one. For news organizations and advertisers, users of these devices, especially those who own large media tablets, have appealing demographic profiles. They tend to be relatively affluent, well-educated and avid news consumers. DEVICE CATEGORIES: Nearly 70 percent of mobile media device owners routinely used two or more mobile media devices. Sixty percent of all smartphone owners used at least one other mobile media device. More than half (51%) of all large media tablet owners also used an Apple iPhone. Among smartphone owners who used one or more additional mobile media devices, 44% owned an Apple iPhone, 37% owned a variety of Android-powered smartphone brands, 14% owned a Blackberry, and about 5% owned some other brand. The following table summarizes responses in each device category. (Source)
The Evolving Video Landscape study released by the Consumer Electronics Association (CEA)® One-third of U.S. adults online (34 percent) say they watch more video content today than they did a year ago. Viewing of television video programming is up 28 percent, with consumers citing convenience and the appeal/variety of programming as the top factors for increased viewing. Viewing of content on portable devices has also increased, with 40 percent watching more on those devices today than a year ago. Many consumers (66 percent) who are watching video content on television are simultaneously using other consumer electronics (CE) devices. This behavior is more prevalent among younger consumers, as 85 percent of 18- to 24-year-olds and 70 percent of 25- to 34-year-olds multitask with another device while watching video on a television. U.S. adults online report watching some type of video content an average of 3.2 hours a day, five days per week. (further details from the source)
 Source Study: American Kids Exposed To Four Hours Of TV Per Day A new study has discovered that children in the United States are being exposed to nearly four hours of background television each day… While previous work has shown that children who are frequently exposed to background TV have shown a correlation with poor performance in cognitive and reading-related tasks, the new study by authors Matthew Lapierre, of the University of Pennsylvania’s Annenberg School for Communication, Jessica Piotrowski of the University of Amsterdam, and Deborah Linebarger of the University of Iowa, is the first to provide an accurate assessment of how much television exposure American kids receive, the International Communication Association (ICA) said in a prepared statement. (Source)
One-fifth of third-graders own cell phones A new study finds that 20 percent of third grade students have cell phones and 90 percent of them are online, while 83 percent of children in middle school have one.  Source
Texting is ultimate social tool for teens, study says Pew found that 63% of all teens say they exchange text messages every day with people in their lives, including their parents. Also, nearly half of all teens send and receive text messages with friends daily. In contrast, 28% teens say they never text their friends — but then, 23% of teens don’t have a cell phone at all. For teens, cell phones appear to correlate with social privilege. Nearly 90% of older teens (aged 14-17) have a cell phone, while just under 60% of 12- to 13-year-olds have a cell phone. White teens are most likely to have a cell phone (81%), vs. 72% of black teens and 63% of Hispanic teens. More than 90% of teens from households earning $75,000 or more annually have a cell phone, compared with 62% of teens from households earning less than $30,000 per year. Also, teens who live in the suburbs or whose parents graduated from college are most likely to have a cell phone. Only about one in four U.S. teens currently uses a smartphone, says Pew, in contrast to about 46% of U.S. adults (Source)
Infographics from the State Of The News Media 2012 report
Amount of Time Spent With Social Media  Source
Study: One-Third of U.S. Households Watch TV Video via Internet
Almost one-third of U.S. broadband Households use the Internet to watch video on their TV sets, according to research firm Park Associates. That number is growing, with 4% of U.S. households buying a video media receiver — including Apple TV and Roku — over the 2011 holiday season, showing “a strong consumer appetite for over-the-top video, said the research firm. (Source)
135 million Americans play video games an hour or more each month Parks Associates reports that 135 million people in the U.S. now play video games for at least one hour each month, compared with 56 million players in 2008. The market research firm also found that 17% of players have downloaded games to their smartphones, compared with 7% in 2008, while 80% use free-to-play games online or on their PCs (Source via ASCD EdTech Smartbrief newsletter)
TV Watching: Youth Are Doing it More on Mobile Devices Television is America’s No. 1 pastime, with an average of four hours and 39 minutes consumed by every person every day. But more and more young people are tuning in elsewhere. Americans ages 12 to 34 are spending less time in front of TV sets, even as those 35 and older are spending more, according to research released February 9 by Nielsen. The divide along a demographic line reveals the effect of Internet videos, social networks, mobile phones and video games — in short, all the alternatives to the television set that are taking up growing slices of the American attention span. Young people are still watching the same shows, but they are streaming them on computers and phones to a greater degree than their parents or grandparents do.
But for three straight quarters, there have been declines in viewing among Americans under 35, even when DVR viewership is factored in, according to Nielsen data analyzed by The New York Times. Adults ages 25 to 34, for instance, watched about four and a half fewer hours of television in the third quarter of 2011 than at the same time in 2010 — the equivalent of about nine minutes a day. Viewers ages 12 to 17 also watched about nine fewer minutes a day. The demographic in between, those ages 18 to 24, watched about six fewer minutes a day. (Source)
Even in 2012, More Americans Own TVs than Cell Phones Some 290 million Americans, in 114.7 million households, own at least one TV. Compare that with 234 million cellphone owners, 211 million Americans who are online, and the 116 million (ages 13 and up) who surf the mobile web. (Source) 

 Source
 |
 Source Source |
 See also How we watch TV now: Viewers are going mobile and multi-tasking
 (source)
Report: U.S. Consumers Watch 16 Minutes of Online Video Ads Monthly With 183 million reported monthly U.S. Internet users, the figure breaks down to just under 16 minutes and 49 seconds worth of online advertising viewed per person. Of the 3.08 million minutes of online video advertising, Hulu accounted for 18.3 percent, or 565 million minutes. Tremor Video accounted for 594 million minutes (19.2 percent) and Adap.tv’s ads represented 551 million minutes (17.9 percent). U.S. adults watched 40.9 billion videos, an average of 20.5 hours per viewer. YouTube was the top online video property for the month, with 151.6 million unique viewers. The service garnered 20.5 billion video views in the month. The average viewer watched 7.4 hours on YouTube. Vevo was second, with 55.4 million viewers. Facebook (50.8 million viewers), Yahoo (50.4 million) and Viacom Digital (47.4 million) rounded out the top five. Hulu was second in engagement, with 3.3 hours watched per viewer. (source)
Mobile Data Usage By Age: Average teen girls sends/receives nearly 4k texts a month 
 Source
Pass the Remote…and the Tablet: Media Study Detects Boost in TV, Mobile Use
According to an eMarketer study of U.S. adult media habits, Americans spent an average of four hours and 34 minutes per day in front of the tube, up 10 minutes from last year (2010).
America’s continued love for couch surfing combined with America’s new found love for their mobile devices–with usage exceeding an hour a day–brought the overall average time spent on major media to 693 minutes per day, report the study authors at research firm eMarketer. That’s over 11 hours of media time a day, folks. The figure is up from 660 minutes last year. Internet usage was the second most popular media activity after TV watching. Americans spent an average of 167 minutes per day on the Internet in 2010, up from 155 minutes last year. 2011 was not kind to radio and print newspapers. No surprise here. Newspapers saw a four minute drop from the year previous, with a 2011 average of 26 minutes per day–half of the time Americans spend on their mobile devices. Magazines dropped from 20 minutes to 18 minutes. (Source) 

First Ever Decline Seen in US TV Ownership  Source: http://yfrog.com/nyo2zsj?mid=5404
Survey reveals teens’ experiences on social networking sites The findings are detailed in a new report called “Teens, Kindness and Cruelty on Social Network Sites: How American teens navigate the new world of ‘digital citizenship,’” from the Pew Research Center’s Internet & American Life Project.
Online Leisure Time Up, Still Trails TV A new study finds that after being flat for five years, the amount of leisure time that Americans spent online grew 20% a year from 2008 to 2010. The report by Needham & Co. analyst Laura Martin, based on an analysis of a U.S. Labor Department survey of 112,000 people, attributes that increase mainly to growing adoption of tablets and other mobile devices. But leisure time spent online still amounts to just 12 minutes a day, or 4% of the five hours total leisure time that people have per day. That’s because only 11% of all Americans report devoting any time to relaxing online, up from 9% in 2008. Within that subset, time spent pursuing online leisure activities was flat at 100 minutes per day between 2003 and 2010. (Source)
Zero to Eight: Children’s Media Use in America (Common Sense Media)  (Source)
  (Source) Among all children up to age 8, an average of one hour and 40 minutes is spent watching television or DVDs in a typical day, compared to 29 minutes reading or being read to, 29 minutes listening to music, 17 minutes using a computer, 14 minutes using a console or handheld video game player, and 5 minutes using a cell phone, video iPod, iPad, or similar device.
In a typical day, zero- to 1-year-olds spend more than twice as much time watching television and DVDs (53 minutes) as they do reading or being read to (23 minutes). And some young children have already begun media multitasking—23 percent of 5- to 8-year-olds use more than one medium “most” or “some” of the time. Among the survey’s key findings:
-
-
-
-
-
-
- 42 percent of children under 8 years old have a TV in their bedroom.
-
-
-
-
-
-
-
-
-
-
- Half (52 percent) of all zero- to 8-year-olds have access to a new mobile device such as a smart phone, video iPod, or iPad/tablet.
-
-
-
-
-
-
-
-
-
- More than a third (38 percent) of children this age have used one of these devices, including 10 percent of zero-to 1-year-olds, 39 percent of 2- to 4-year-olds, and more than half (52 percent) of 5- to 8-year-olds.
-
-
-
-
-
-
-
-
-
- In a typical day, one in 10 zero- to 8-year-olds uses a smart phone, video iPod, iPad, or similar device to play games, watch videos, or use other apps. Those who do such activities spend an average of 43 minutes a day doing so. (Source)
-
-
-
-
Read the summary | Download the full report
 (
(New Orleans Watches Prime-Time the Most, and Other Regional Facts of Media Life 
The number of people watching time-shifted TV in the second quarter leapt 12.9% from a year earlier, even though the number of people watching TV overall only grew 0.6%, according to new research from Nielsen. (source)
Half Of Americans Watch Online Video: Nielsen Internet video streaming is officially mainstream — with 48% of U.S. consumers now watching some video online — but TV remains the great American pastime, according to Nielsen’s quarterly report on media consumption. Monthly time spent watching traditional TV in the second quarter of 2011 climbed 1.9%, to 146 hours and 20 minutes, a year-over-year increase of 2 hours and 43 minutes of monthly viewing, according to the Nielsen Cross-Platform Report for Q2 2011. By contrast, time spent watching video on the Internet was 4 hours and 26 minutes per month on average, up 15% from a year ago — just 3% of the time parked in front of the TV. And Americans spend more than four times watching time-shifted TV — on DVRs and video-on-demand — than watching online video, according to the Nielsen study. (Source)
National Newspaper Week (October 2-8, 2011) Newspapers still have 50 million customers each weekend, and 400 million sets of eyeballs purchase a newspaper every week. Additional perspective: 10 million adults used Twitter in the last month; 164 million read a newspaper in print or online last week. (Source)


 click image above to go to the full infographic (source)
Americans Spend 23% of Online Time on Social Networks Americans spend almost a quarter of their time online on social networking sites, says a Nielsen report released September 12. According to the report — which combines data from Nielsen mobile and online meters, buzz data and a survey — Internet users spend more than twice as much time on social networks (including blogs) as they do on online games, the next top web destination by time. The most popular social network as measured by Nielsen online meters is Facebook, followed by Blogger, Tumblr, Twitter and LinkedIn. (Source)
American Millennials Study
Millennials watch significantly less TV than Non-Millennials, says the report, watching 20-plus hours/week (26% versus 49%). When not watching live TV, Millennials are much more likely to watch shows mainly on their laptops (42% versus 18%), with DVR (40% versus 36%), or On-Demand (26% versus 18%) (Source)
TV & Video Consumer Trend Report 2011 ConsumerLab has released the results of its annual study TV & Video Consumer Trend Report 2011, which reveals that people are spending slightly less time watching scheduled broadcast TV, and that they are spending more time watching streamed on-demand TV online. More than 44 (38) percent of the respondents reported watching Internet-based on-demand TV more than once per week, while about 80 percent watch broadcast TV more than once per week. (Source)
Half of Tablet Owners Watching Both TV & Films the research firm In-Stat has found that about half of all tablet owners are watching both feature length films and TV shows on their tablet devices. Looking at the wider tablet/smartphone universe, In-Stat found that about 86% of tablet and smartphone owners are using them to watch video and nearly 60% of smartphone/tablet owners are viewing over-the-top video at home. (Source)
Half of American adults use Facebook, other social networks: Pew Study Social media sites continue to surge in popularity, and now half of all American adults using Facebook, MySpace and LinkedIn, according to a new survey released Friday by the Pew Research Center. The study reported that 65 percent of all online adults surveyed in May said they were using social networking sites, up from 61 percent a year ago. The social media users represent 50 percent of all American adults, Pew said. (Source)
Videogame Consoles: Top Internet Connected Device Data from Leichtman Research Group (LRG) showed that as of February 2011, 30% of US households had at least one internet-enabled device connected to their TV, a percentage that has grown slowly but steadily over the past few years. More specifically, LGR found that while only 10% of US households had an internet-connected TV, almost a quarter (23%) had an internet-enabled game console they used to watch online video. (Source)
How Teens Interact With Media Teens today are the most digitally connected generation we have ever seen. A study released in late June by Nielsen on teen media usage offers some interesting insight into the connected people of the class of 2011. (Source)
Top Genres of Mobile Video Consumption by Reach – Mobile Video Users Ages 13-17

Mobile Media Usage by US Teens – 13-17 Mobile Users
 Average Number of Monthly Texts vs. Phone Calls – US Mobile Teens Ages 13-17

Multitasking TV Viewers Profiled  Source
Minority kids spend most of their waking hours plugged in

 (source)
Seven Ways Teens Communicate
The graphic below shows daily use of a variety of communication technologies – and suggests that while text messaging as a daily activity for teens has grown astronomically over the past three years, other communicative technologies have remained relatively stable or have declined slightly, suggesting that the increase in texting has layered on top of the other modes of communication that teens employ. (Source)

Kids increasingly spending time with multiple online channels 
 Source
TV Ownership Dropping
New research from the Nielsen Company found that 96.7 percent of American homes have at least one television, down from 98.9 percent the last time Nielsen took count. This is the first time in 20 years that TV ownership has declined. Nielsen partly blames the drop on poverty combined with broadcast television’s switch from analog to digital. (Source)
Time Spent Watching TV

 (Source)
America’s Media Thirst Unquenchable, Claims Study 
 the report—The Infinite Dial 2011: Navigating Digital Platforms—Americans are spending an hour and 21 minutes more time per day with media than in 2001. 31 percent of Americans claim to own a smartphone, according to Arbitron/Edison’s report, up from just 14 percent a year ago. it found that more than half of Americans 12 and older (51 percent) use Facebook, up from 8 percent just three years ago. total weekly usage of online radio has doubled in the past five years, netting out at 9 hours 47 minutes per week. In fact, the audience for Web radio has doubled every five years since 2001 and now exceeds 57 million teens and adults each week, or 22 percent of Americans 12 and older. (Source)
Ad Exposure According to Roy H. Williams, whose Wizard of Ads books I have found inspiring and helpful, “A recent Yankelovich study tells us that Americans are confronted by more than 5,000 selling messages per day – radio and television and magazines and newspapers and billboards floating on an ocean of store signage, posters, point-of-purchase displays and product packaging – each one hoping to gain our eyes, ears and attention.” (Source; also cited here)

Most People Spend More Than Half Their Day Consuming Media  http://www.thewrap.com/media/column-post/people-spend-more-12-day-consuming-media-study-finds-21005
Average Twitter User Older Than Expected Flowtown found that Twitters users, on average, are 39 years old, while those who use LinkedIn are an average of five years older. Nearly half (47 percent) of all internet users between 50 and 64 years of age also have at least one social media account. Even 26 percent of those aged 60 and above use Facebook, Twitter or another social media website on a regular basis. A full 61 percent of all adults surveyed by Flowtown indicated that they had used social networking websites in the past, representing an impressive rise from the 47 percent measured a year ago, in August 2009. Thirty-eight percent of adults responded that they use social media on a daily basis. Most interesting of all the findings is the fact that nearly four-in-ten internet users between 30 and 49 years of age use social media every day. This proportion is six out of ten in the 18 to 29 age cohort. (Source)
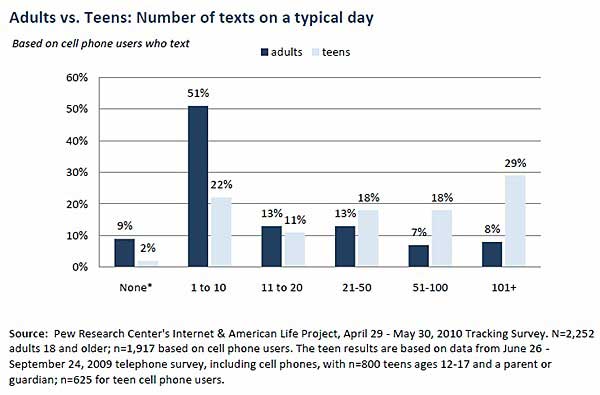
Adults, Cell Phones and Texting (Pew)
Texting by adults has increased over the past nine months from 65% of adults sending and receiving texts in September 2009 to 72% texting in May 2010. Still, adults do not send nearly the same number of texts per day as teens ages 12-17, who send and receive, on average, five times more texts per day than adult texters.
-
-
-
-
-
-
- Adults who text typically send and receive a median of 10 texts a day; teens who text send and receive a median of 50 texts per day.
-
-
-
-
-
-
-
-
-
-
- 5% of all adult texters send more than 200 text messages a day or more than 6,000 texts a month. Fully 15% of teens ages 12-17, and 18% of adults ages 18 to 24 text message more than 200 messages a day, while just 3% of adults ages 25 to 29 do the same.
-
-
-
-
-
-
-
-
-
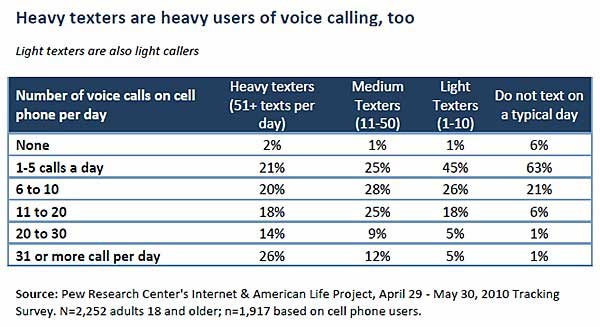
- Heavy adult texters — those who send and receive more than 50 texts a day — also tend to be heavy users of voice calling. Light texters, who exchange one to 10 texts a day, do not make up for less texting by calling more. Instead, they are light users of both calling and texting. ( Source)
- Heavy adult texters — those who send and receive more than 50 texts a day — also tend to be heavy users of voice calling. Light texters, who exchange one to 10 texts a day, do not make up for less texting by calling more. Instead, they are light users of both calling and texting. ( Source)
-
-
-
-

Study Indicates Changes In TV Viewing Habits The study, titled “Multi Screen Media Consumption 2010,” revealed that 50 percent of the 300 million consumers polled were viewing Internet TV on a weekly basis . The study also indicated that individuals are now spending up to 35 percent of their leisure time in watching television. The study also indicated that 93 percent of those surveyed are still watching “linear” broadcast television, and 70 percent report that they are streaming, downloading, or watching recorded broadcast television offerings on a weekly basis. (Source)
Social Networking Dominates U.S. Web Use; Facebook Leads The Way According to Nielsen, U.S. users currently spend 23 percent of their time on the Internet using social networking platforms. And Nielsen puts the massive increase in social networking use squarely on the shoulders of Facebook, which just recently reached more than 500 million users to become the most widely used social networking platform globally. While social networking gathers steam, Nielsen also found that 10 percent of U.S. Internet time is spent playing games, which has now overtaken email as the second most popular online activity. Email dropped 28 percent from 2009 to 2010 and now represents 8.3 percent of online time, (Source)
Mobile Access 2010 report/study the Pew study discovered that 38 percent of U.S. adults who have a mobile device access the Internet with it in May 2010, up from 25 percent in April 2009, 82 percent of U.S. adults has a mobile device, which translates into just more than 31 percent of all U.S. adults use a mobile device to log onto the Internet this year. 11 percent of U.S. adults who have a mobile device — or 9 percent of the entire adult population — have made a purchase with their phones. That number jumps to 20 percent among those between the ages of 18 and 29. 23 percent of U.S. adults who own a mobile device — or 19 percent of the entire adult population — have accessed an online social network, 20 percent have viewed a video and 11 percent have contributed to charity, all via their mobile phones. (Source)
Profile of the Average Gamer (June 2010) Today’s average gamer is 34 years old, according to a study of 1,200 households by the Entertainment Software Assn. The most frequent game purchaser is 40. Nearly half of all gamers are between 18 and 49. More surprisingly, more than a quarter of the gaming population is over 50. The average adult gamer has been playing computer or videogames for 12 years. The ESA reports that 48% of parents play videogames with their kids at least once per week. And 67% of American homes either own a console, and/or use their PC to run entertainment software (Source)
Blogosphere dominated by younger Americans Bloggers age 21-35 accounted for 53.3% of over one million blog posts analyzed, followed by bloggers under age 20 (20.2%), those age 36-50 (19.4%), and those age 51+ (7.1%). (Source)
Adults Spend Twice as Much Time on TV Than Web People age 18-plus watched 319 minutes of television a day, according to the Media Comparisons Study 2010 commissioned by the Television Bureau of Advertising (TVB). That figure more than doubles the time spent on the Internet (156.6 minutes), and dwarfs daily time spent engaging with radio (91.2 minutes), newspapers (26.4 minutes) and mobile (19.2). Other findings showed that television reaches nearly 90% of people 18-plus every day, better than the Internet’s 67.5%, radio’s 60.6% and newspapers’ 38.6%, and TV reaches over 80% of the general population. (Source)

 (Source)
Teens and Cell Phones (Pew Study, April 2010) * The typical American teen sends and receives 50 or more messages per day, or 1,500 per month. And there are a sizeable number who do much more than that: 31% of teens send and receive more than 1 00 messages per day or more than 3,000 messages a month; 15% of teens who are texters send more than 200 texts a day, or more than 6,000 texts a month. · The report runs down a lot of details about the things that teens do with their phones besides texting and talking. For example: 83% use their phones to take pictures; 60% play music on their phones; 46% play games on their phones; 32% exchange videos on their phones; 27% go online for general purposes on their phones; 23% access social networking sites on their phones. (Source)
Cell phones and texting
-
-
-
-
-
-
- Texting is the No. 2 use of cell phones after checking the time.
-
-
-
-
-
-
-
-
-
-
- Sixty-five percent of high school students use cell phones in school.
-
-
-
-
-
-
-
-
-
- One-quarter of text messages sent by teens are sent during class.
-
-
-
-
-
-
-
-
-
- Text messages connect kids instantly and privately.
-
-
-
-
-
-
-
-
-
- Images and messages can be spread virally or uploaded.
-
-
-
-
-
-
-
-
-
- Teens with phones averaged nearly 2,900 texts a month — a 566 percent increase in two years. (Source: Common Sense Media, quoted here)
-
-
-
-
18th Edison Research/Arbitron Internet and Multimedia Study
One in four Americans 12 or older have listened to audio from an iPod or alternate MP3 player connected to a car stereo. 52% of Americans have listened to online radio. In March 2010, 70 million Americans listened to Internet radio (27%). Three in ten who are 12 – 24 years old are “very interested” in online radio for car or mobile devices. The weekly online radio audience is 43 million people (the same as in 2009) or 17% of the total population, 12 years or older. (Source)
Half of Americans Have Profiles on Social Networking Sites Social media seems to have come of age as a new national survey from Arbitron and Edison Research indicates that the percentage of Americans ages 12 and older who have a profile on one or more social networking Web sites has reached almost half (48 percent) of the population in 2010. (Source)
More Americans Watching TV & Internet Together (Nielsen) Americans increased their overall media usage and media multitasking according to The Nielsen Company’s latest Three Screen Report, which tracks consumption across TV, Internet and mobile phones. In the last quarter of 2009, simultaneous use of the Internet while watching TV reached three and a half hours a month, up 35% from the previous quarter. Nearly 60% of TV viewers now use the Internet once a month while also watching TV. (Source)
State of The News Media 2010 (excerpts) Audiences for news declined on all platforms except digital and cable, the study reports, with the bulk of the online traffic for news attracted by the biggest operations: “Of the 4,600 (news and information) sites, the top 7 percent collect 80 percent of the traffic. And the top 20 sites attract the majority of that (most of them legacy media).” (Source) Two-thirds of the top news sites were either pure news aggregators (like Google and Yahoo news) or had a strong aggregation element (like MSNBC or AOL). The age group most likely to use a news aggregation service was 18-29 (68 percent), followed by 30-49 (57 percent), followed by 50 plus (45 percent). (Source)
Pew Report: 26% Read News on Mobile Devices A new report from the Pew Center’s Project for Excellence in Journalism reveals that more than a quarter of Americans read news on mobile devices, and those who do are highly engaged participants as well as being voracious grazers of news and information. The report, “Understanding the Participatory News Consumer,” examines the impact of digital media on news consumption and interaction behaviors. A section of the study focused specifically on the growth of mobile devices reveals that more than 80 percent of adults now own cell phones and 37 percent use their phones to access the Web. (Source)
FCC: Cell phone use high; mobile web use low According to new research from the Federal Communications Commission: 86% of Americans own a cell phone; fewer than one third use their devices to access the mobile Web. In contrast, 66% have sent or received text messages. Among younger cell phone owners, 48% of those ages 19-29 access the mobile web compared to only 5% of those over 65. (Source) FCC: One third of Americans don’t use fast Internet The study found that 80 million adults and 13 million children either still use dial-up or don’t use the Internet at all at home  Source for graphic
Journalists’ Use of Social Media Soars Nearly 70% of journalists surveyed are using social networking sites, a 28% increase since the results of the 2008 Survey of Media in the Wired World were released; — 48% are using Twitter or other microblogging sites and tools, a 25% increase since 2008 (Source)
Cell phones and Texting A December 2009 study by the Pew Research Center showed that 68% of cellphone owners 18 and older send text messages. A deeper dive reveals the biggest texters to be 18- to 24-year-olds (95%). And while that stat shouldn’t floor anyone, what may surprise is just how many people are texting within the older sets, including 25- to 34-year-olds (87%); 35-44 (74%); 45-54 (69%); 55-64 (43%) and 65-plus (20%). (Source)
Facebook Mobile Tops 100 Million Users More than 100 million people are actively using Facebook from their mobile devices every month, a 54% increase from the 65 million people who did so just six months ago, according to Facebook. Source
Time Spent Social Networking Up 82%  Source
Kaiser Generation M2- Kids/Youth/Media Survey (January 2010)  source
  (Source)
  Source: CNET
  Source: ZNET
  Source: ZNET
TV: Where Most Americans Will Get Their Political News A recent Rasmussen poll found that a clear majority of Americans – 59% — plan on getting most of their political information from their television sets this year. That number represents the combined total for cable and broadcast sources.The breakdown of the 59% is 37% cable, 22% broadcast. The internet is second with 21%. Newspaper and radio trailed, with neither able to break into double digits, pulling responses of 9% and 7% respectively. 18% now get political updates over a phone or other mobile device, with 18-29-year-olds twice more likely to do so than the 65+ crowd. (Source)
Televisions In The Home
As of November (2009), according to media researcher Nielsen, 29.9 percent of TV-owning households in the U.S. have four or more televisions–that’s very close to one-third of the 115 million domestic domiciles that have at least one television set. Among the other, relatively impoverished TV households, 25.1 percent have three sets, 28.3 percent have two, and 16.7 percent have a measly single TV. As you might expect, that many televisions translates to some lofty numbers in other TV-related sectors. Nielsen found that 103.6 million U.S. homes are cable- or satellite-ready. Approximately 51 million American homes have digital cable. ( Source)
Game Console Data Released
State of the Media Democracy Report According to Deloitte’s fourth annual report 34 per cent of Americans cite TV as their favorite medium, up from 27 per cent last year. Second through fourth, respectively, were Internet, music and books, all of which are perceived by the average consumer as being less expensive than a night out at the movies. While 71 per cent of respondents say watching TV is one of their top media choices, only 22 per cent listed going to the movies among their top 3. (Source)
 Source: Newsweek Magazine, 12/7/09, page 23
Internet Use & The Elderly In the last five years, the number of Seniors 65+ actively using the Internet grew 55% from 17.5 million in November of 2009 up from 11.3 million in November of 2004 according to a recent survey by Nielsen. Among online visitors 65+, 88.6% say checking their personal email is their top online activity. (Source)
Middle School Student Media Consumption Study Results According to the Ratheon study, 72 percent of U.S. middle school students spend more than three hours each day outside of school in front of a TV, mobile phone or computer screen rather than doing homework or other academic-related activities. The study found that students spend a lot of time in front of a screen doing one or more of the following activities: watching TV, playing video games, sending text messages or using the computer (for non-school related tasks). (Source)
Texting getting more popular with older generation Texting is becoming more and more popular with older people in the UK, reports Media Week citing research from mobile messaging technology provider Tekelec. The research found that 60 percent of Brits aged over 45 are now as likely to text as make voice calls on their handsets. It found than 44 percent of those aged 35-44 and 14 percent of those aged 45 and over send more than 30 texts a week. It also showed that texting is more popular with women than men – with over 40 percent of women seeing themselves mainly as ‘texters’, versus 30 percent of men. (Source)
How Much Information? Study An average American digests a whopping 34 gigabytes of information outside of work every day, according to a new study from the University of California, San Diego. The UCSD researchers estimate we each ingest about 100,500 words daily from various forms of media. In all, it’s about 350 percent more data than we were swallowing down just three decades ago. Excerpts: -Contrary to some popular perceptions, adults are watching far more TV than teens. Americans age 60 to 65 spend more than seven hours a day being idly entertained; teenagers, on average, spend about four. -This one may come as a surprise: Nineteen percent of our nonwork info-gathering time is taken up by radio-listening. The majority of that, the researchers find, is during our commutes. – Believe it or not, computer use accounts for only 24 percent of our info-ingesting hours, work excluded. That includes Web-surfing, game-playing, video-watching, and whatever else you may or may not be spending two hours a week doing online – E-mail’s the most widely used Internet service, taking up more than a third of America’s total online hours. Web browsing is a close second, at about 30 percent. (Source)
 (Source NYT, November 16, 2009)
US TV Viewing at All Time High
Media Reach, Audio and Radio
According to a Nielsen analysis of a media study conducted by the Council for Research Excellence, 77% of adults are reached by
broadcast radio on a daily basis, second only to television at 95%. The study found that Web/Internet (excluding email) reached 64%, newspaper 35%, and magazines 27%. And, in a deeper analysis of audio media titled “How U.S. Adults Use Radio and Other Forms of Audio,” Nielsen found that:
-
-
-
-
-
-
- 90% of consumers listen to some form of audio media per day
-
-
-
-
-
-
-
-
-
-
- The 77% who listen to broadcast radio surpass the 37% who listen to CDs and tapes and the 12% who listen to portable audio devices.
-
-
-
-
-
-
-
-
-
- Almost 80% of those aged 18 to 34 listening to broadcast radio in an average day. (Source)
-
-
-
-
Nielsen: Kids watching TV at eight-year high
According to Nielsen Media Research, children aged 2-11 spend more hours in front of the tube than they have since at least 2001. Kids aged 2-5 average more than 32 hours a week in front of a TV. Kids 6-11 spend a little less, about 28 hours per week, presumably because they’re spending more time in school. Both measures are the highest levels recorded by Nielsen during the study period. (source)
Traditional News Media Still the Source for Most on Major News, According to 2009 State of the First Amendment Survey Television was the first source for major news stories for about half of all responding (49%), followed by the Internet at 15%, radio at 13% and newspapers at 10% — which places traditional news media (TV, radio and newspapers) as the first source for 72% of Americans. Twitter, e-mails and social-networking sites each were named by 1% of those responding. Similarly, for 48% of Americans TV is the primary source for follow-up reports on those news stories, followed by the Internet at 29% and newspapers at 9%. (sources: Reuters; First Amendment Center)
Digital Video Awareness Grows; YouTube Still Dominates More than two-thirds (67%) of online Americans now report that they have streamed or downloaded digital video content from the internet, and most feel it’s reasonable to watch embedded ads in online TV and movies if the desired video content remains free-of-charge, according to data from Ipsos MediaCT’s most recent MOTION study. (Source)
Study: TV programming viewed online in 25% of U.S. households A new survey by the Conference Board reports that almost 25% of U.S. households watch TV shows online as opposed to 20% just one year ago. Of these viewers, 43% watch news shows, 35% sitcoms, comedies and dramas, around 20% watch reality programming and 18% sports. (Source)
VIEWERS USING WEB & TV SIMULTANEOUSLY: Nielsen study Nielsen said in a report that 57 percent of TV viewers in the U.S. who have Internet access use both mediums at the same time at least once a month. The Nielsen study found the average TV viewer who uses the Internet simultaneously does that for 2 hours and 40 minutes a month, and that 28 percent of the time they are on the Web at home, they are also watching television. (Source; AdWeek)
HOW PEOPLE — USE MOBILE VIDEO Two-thirds of Americans now own a video-enabled mobile device, including iPods, cell phones, and laptop computers, up from less than half three years ago, according to new data being released September 2 by Knowledge Networks. Of Americans age 13-54, 65.7% of them have at least one video-enabled mobile device, up from 44.9% in a 2006 KN study. The study indicates that laptop computer are the most prevalent technology, with 57.3% of Americans now owning one, up from 42.8% in 2006. (Source)
SOCIAL NETWORK POPULARITY Forrester’s report (“The Broad Reach of Social Technologies” ) found that 51% of online U.S. adults utilize social networking sites such as Facebook or LinkedIn, a large increase from the 25% of users who reported using social networking sites in 2007. The survey classified a full 73% of online U.S. adults as spectators, a big increase from the 48% that it classified as such in 2007. Additionally, the number of users who consume no social media has fallen from 44% in 2007 to 18% this year. (Source) Almost all U.S. youths ages 18-24 participate in social media at least once a month. (Source) “Now more than half of adults aged 35 to 44 are in social networks. 70% of online adults, ages 55 and older, tell us they tap social tools at least once a month; 26 percent use social networks and 12 percent create social content. As a result, social applications geared toward older adults will now reach a healthy chunk of their audience.” (Source)
US TEEN CELL PHONE — USE GROWS (Pew Study) In 2004, less than half of U.S. teens aged 12 to 17 owned a cell phone, compared to 65 percent of adults. By 2008, teens owning cell phones had increased to 71 percent, versus 77 percent of adults…… the cell phone wasn’t the most prevalent electronic device teens owned, at least in 2008. The most popular gadget was a game console, owned by 78 percent of the respondents. Next was an iPod or other MP3 player, which just edged out the mobile phone with 74 percent. Only 60 percent of teens said they owned a PC, whether it be a desktop or notebook. (Source/ Pew Study)
COMMON SENSE MEDIA’s POLL OF SOCIAL NETWORKING (Aug 2009) Teen social networking by the numbers 51 Percentage of teens who check their sites more than once a day. 22 Percentage who check their sites more than 10 times a day. 39 Percentage who have posted something they later regretted. 37 Percentage who have used the sites to make fun of other students. 25 Percentage who have created a profile with a false identity. 24 Percentage who have hacked into someone else’s social networking account. 13 Percentage who have posted nude or seminude pictures or videos of themselves or others online.
REACH OF HOME GAME CONSOLES & HDTV 40%of US households own a video game system, according to a August 2009 report from the Cable & Telecommunications Association for Marketing.But that number is flat from last year, said the study. The most notable growth area was in high-definition television adoption. HDTV ownership grew from 35 percent last year to 53 percent this year. (Source)
NIELSEN: MORE TVs THAN HUMANS IN US In 2009, there were nearly 115 million TV homes in the US, each averaging 2.86 TV sets, according to a new Nielsen study. That computes to nearly 329 million TV sets — more than the entire US population, estimated at 307 million by the US Census Bureau. (Huff Post; NY Post)
SIMMONS NEW MEDIA STUDY RESULTS What activities do Americans do during a typical day, and how much time do they spend on each activity? The five activities that take up the most time besides sleeping (6.1 hours) are: 1. working (6.6 hours), 2. watching television (3 hours), 3. using the Internet on a home computer (2.4 hours), 4. listening to the radio (1.7 hours) and 5. reading books (1.5 hours). Which activity are Americans most likely to multitask on? Nine out of 10 online adults watched television in the last 24 hours, and 72 percent of them multitasked by using at least one of 12 other measured media. The three other activities they perform while watching television are surfing the Web (not emailing) (27 percent), using their cellular phone (26 percent) and emailing (23 percent). (Source)
WHO’S USING FACEBOOK? People 35 to 54 are now (July 09) the biggest age group on the Web site, accounting for 28.2 percent of all U.S. users as of July, according to iStrategyLabs, an online marketing firm. Following close behind are 24- to 34-year-olds, who represent 25.2 percent of users. (Source)
REPORT SAYS MORE GIRLS ARE USING VIDEOGAMES The NPD Group in the report “Gamer Segmentation 2009,” says that 28% of females are playing video games on gaming consoles. That number is up 5% from 23% in 2008. Of the 65% of American households who play video games or computer games, according to a 2008 Entertainment Software Association (ESA) study, female gamers make up 40% of all players. And not all female gamers are young. The 2008 ESA study reported that 33% of women ages 18 and up play video games – surpassing the 18% of boys ages 17 and younger who play video games. (source)
TEEN ADVERTISING STUDY  Source
HOW TEENS — USE MEDIA (link to the report ) The leading type of media use among teens is still television, with the average teenager watching 3 hours and 20 minutes per day, countering the myth of YouTube as the lead medium. Actually, Nielsen says that teens watch more TV than ever, with usage up 6% over the past five years in the U.S. In comparison, a typical teen only watches about 11 minutes of online video per day, Nielsen found, or an average of about 3 hours per month. That is much less than adults ages 18-24 who watch 5 hours and 35 minutes per month and even less than adults ages 35-44 who watch 3 hours and 30 minutes per month Other key findings of the study include: * Half of all teenagers use an audio-only mp3 player each day, while one in four watch video on an mp3 player. * On an average day, one in four teens reads the newspaper. * While teens multi-task in their media usage, this behavior may actually be lower than among adults. * South African, Venezuelan and Indonesian teens are the biggest couch potatoes. * 35% of U.S. teens may have DVRs, but they prefer live TV viewing. (Source)
-
-
-
-
-
-
- In one study, teens were consuming one form of media 77% of the time while observed, making them less prolific multitaskers than adults when it comes to media.
-
-
-
-
-
-
-
-
-
-
- “Television is still the dominant medium of choice for teenagers” and they’re watching more of it than ever before.
-
-
-
-
-
-
-
-
-
- Teens prefer live television to DVR time-shifted programming.
-
-
-
-
-
-
-
-
-
- When it comes to going to the movies, teens lead the pack and prefer the big screen to DVDs, online rentals and on-demand offerings.
-
-
-
-
-
-
-
-
-
- Teens consume less online video than adults.
-
-
-
-
-
-
-
-
-
- With 11 hours and 32 minutes a month of web browsing, teens are surfing the net half as much as the average US internet user.
-
-
-
-
-
-
-
-
-
- Teens generally visit the same categories of sites as adults do.
-
-
-
-
-
-
-
-
-
- Despite the popularity of online music and portable music devices like the iPod, “Radio is the top source of music consumption for 16% of teens globally and the secondary source for another 21% “.
-
-
-
-
-
-
-
-
-
- 29% of teens aged 18-20 claim to read the newspaper daily; 34% claim to read the newspaper on Sunday.
-
-
-
-
-
-
-
-
-
- Teens are more receptive to advertising than adults once ads get their attention. (Source)

- Teens are more receptive to advertising than adults once ads get their attention. (Source)
-
-
-
-
BROADBAND INTERNET ACCESS the Pew Internet and American Life Project’s latest study found that 63 percent of Americans now have high-speed access at home, compared to 55 percent in May 2008. (Source)
SURVEY: ONE IN FOUR KIDS HAVE THEIR OWN GAME CONSOLE the recent NPD Group survey also found that 37 percent of kids aged 4 to 14 who use a portable gaming console (such as the Nintendo DS or the Sony PSP) actually own them—or rather, their parents and/or generous family member/friend gave them one. (And in nine out of ten cases, it was brand new.) The figure for personal media players: 30 percent. (Source)
CENSUS REPORT: INTERNET — USE SOARS 64% of Americans 18 and older reported using the Internet in 2007, up from just 22% a decade earlier. 62% of the nation’s households report using the Internet at home in 2007, an 18% increase from 1997. Among households using the net in 2007, 82% reported using a high-speed connection, and 17% used a dial-up connection. (Source; see also Census PR)
STUDY: 99% OF VIDEO IS STILL SEEN ON TV This study, which was sponsored by media research firm Nielsen, however, concludes that the average adult in the U.S. still watches an almost unbelievable 5 1/2 hours of live TV every day. 94% of adults watch TV on any given day, while most people only watch online videos for a few minutes a day. TV (including DVR playback) represents 99% of all the video watched by U.S. adults, and even for the youngest group in the sample, those 18-24, online video only represented 2% of all screen time. Users 18-24 spend more time in front of their computer screens than any other group (143 min a day on average), but still watch 210 min of TV every day.The older a person, the more time they are likely to spend in front of their TV (421 min for those 65 and older). (Source)
AGING PRINT READERSHIP The average age of magazines’ readers is catching up with the overall population. The media age of adults in the US increased 1.3 years to 45.2 since Spring 2004, according to the Spring 2009 Mediamark Research report. But adult readers at the nearly 200 publications and publishing groups tracked in both studies saw their median age rise 1.6 years to 44. About 56% of the titles tracked in both years posted age increases higher than the general adult populations. (Source)
NIELSEN SAYS AMERICANS WATCH MORE TV THAN EVER Three Screen Reports indicates: the average American watches approximately 153 hours of TV every month at home, a 1.2% increase from last year. In addition, the 131 million Americans who watch video on the Internet watch on average about 3 hours of video online each month at home and work. The 13.4 million Americans who watch video on mobile phones watch on average about 3 ½ hours of mobile video each month. (Source)
STUDY: MULTITASKING TV & WEB RISES BETWEEN MONDAY AND THURSDAY Nearly three times the number of people combine TV watching and Internet surfing on Thursdays than do so on Mondays, according to a new study. As reported by Adweek, the study by Integrated Media Measurement Inc. found that 5.8 percent of viewers watching broadcast television multitask with Internet use on Monday, rising to 15.9 percent by Thursday. (Source)
INTERNET BECOMES FORCE IN 2008 PRESIDENTIAL ELECTIONS More than half of U.S. adults used the Internet to participate in the 2008 election — the first time that threshold has been crossed Some 55 percent searched for political news online, researched candidate positions, debated issues or otherwise participated in the election over the Internet
(Sources: Reuters; link to Pew study)
TECHNOLOGY IN THE WORKPLACE According to the Technology Gap Survey’s findings, new technologies have blurred the lines between personal and professional tasks – especially online technologies such as blogs and social networking sites. The survey found:
-
-
-
-
-
-
- Gen Y workers spend an average of 10.6 hours a day accessing social networking sites, news Web sites, blogs, Internet forums, and multimedia sharing Web sites, versus 5.6 hours reported by Boomers.
-
-
-
-
-
-
-
-
-
-
- Sixty-two percent of Gen Y professionals report accessing a social networking site from work, versus only fourteen percent of Boomers.
-
-
-
-
-
-
-
-
-
- Thirty nine-percent of Gen Y workers report using gaming programs at work, versus fourteen percent of Boomers. Source: Press release; link to survey
- Thirty nine-percent of Gen Y workers report using gaming programs at work, versus fourteen percent of Boomers. Source: Press release; link to survey
-
-
-
-
Watching TV On The Internet
-
-
-
-
-
-
- TV viewing on the Internet is increasing; 33 percent of broadband consumers under the age of 30 watch a TV program on the Internet at least once per week.
-
-
-
-
-
-
-
-
-
-
- Consumers over 30 who watch a TV program on the Internet weekly watch 20 percent less traditional, live TV broadcasts than their peers. (Source: Connected Life Market Watch quoted here)
-
-
-
-
Video Consumption in the US (Ball State University’s Center for Media Design and Sequent Partners for the Nielsen-funded Council for Research Excellence) –99% of video consumption on televisions, the Web and mobile is on traditional TVs – Younger baby boomers in the 45- to 54-year-old age group average the most daily screen time, a little more than 9 ½ hours. Other age groups average about 8½ hours. -The study found that TV users were exposed to 72 minutes per day of TV ads and promos – The data shows that 18-to-24-year-olds — generally college students and new entrants into the work force — watch the smallest amount of live TV of any age group (three and a half hours a day), spend the most time text messaging (29 minutes a day) and watch the most online video (5.5 minutes a day). (Sources: New York Times; TV Week; link to press release)
American Kids Study 2008/Mediamark Research & Intelligence (MRI) (excerpts) American kids age 6-11: 71.1% accessed the Internet in the past 30 days -Of those: 83.4% did their Web surfing at home; School (#2) 29.6%, bookstore/library(3rd) 6.82% – 81.2% reported accessing the web to play online games – 86.8% of youths played a video game; 29.1% played a video game on a cell phone – Of the nearly 50 Web sites measured by the study, three of the top five are TV sites (Disneychannel.com, Nick.com and Cartoonnetwork.com) – More than half (57.0%) accessed the web because advertising drove them there. (Source;Source)
Using Cell Phones To Access News number of people getting news via cellphone doubled from 10.8 million in January, 2008 to 22.4 million in January, 2009, according to comScore. (source) According to the New York Times, 17.5 million young people, aged 13-17, own cell phones
News Sources & Habits: Pew Research Center for People and the Press

Social Nets Overtake Email Social networking has overtaken e-mail as the most popular Internet activity, according to a new study released by Nielsen. Active reach in what Nielsen defines as “member communities” now exceeds e-mail participation by 67 percent to 65 percent. What’s more, the reach of social networking and blogging venues is growing at twice the rate of other large drivers of Internet use such as portals, e-mail and search. (Source)
Alcohol & Influence on Teens an estimated 11 percent to 20 percent of U.S. teens have T-shirts, headwear, jewelry, key chains and other paraphernalia emblazoned with brands of alcoholic beverages (Source)
Global Mobile Phone & Internet Use – Six in ten people around the world now have cell phone subscriptions; developing countries now account for about two-thirds of cell phones in use – Internet use more than doubled. An estimated 23 percent of people on the planet used the Internet last year, up from 11 percent in 2002. (source: International Telecommunication Union report; AP News story)
Mobile, DVR Video Show Fastest Growth The Nielsen Company reported (February 23) that viewing of video on television, Internet and mobile devices — the Three Screens — continues to increase and has reached new heights. In its fourth quarter “A2/M2 Three Screen Report,” Nielsen reported that the average American watches more than 151 hours of TV per month, an all-time high. Meanwhile, Americans who watch video over the Internet consume another 3 hours of online video per month and those who use mobile video watch nearly 4 hours per month on mobile phones and other devices. (Source, Nielsen PR)
Who’s Twittering? Over one in ten (11%) online adults in the US say they have used Twitter — or a similar service –- to share updates about themselves or view updates about others. Nearly one in five (19%) online adults ages 18-24 used Twitter and similar services, as have 20% of online adults age 25-34. Use of these services drops steadily after age 35, with 10% of 35- to 44-year-olds, and 5% of 45- to 54-year-olds, using Twitter. The decline is starker among older internet users; 4% of 55-64-year-olds and 2% of those 65 and older use Twitter. 14% of users who access the internet wirelessly via a laptop, handheld or cell phone have used Twitter or the like, compared with 6% of users who go online but do not do so wirelessly. (source-Pew Internet & American Life Project)
Handheld devices and youth study – nearly nine in ten (86%) of 15 to 17 year-old Internet users have a handheld device, whether it is a cell phone (69%), an iPod or other MP3 player (66%), a PSP (31%) or a Smartphone (12%). According to the study, one quarter (26%) of 15 to 17 year-old Internet users pay for Internet access on their cell phone, compared to 11% of 35 to 49 year-old Internet users. Similarly, one quarter (24%) of 15 to 17 year-old Internet users watch video on their handheld devices on a monthly basis. (Source The Broadband Content and Services 2008(TM) Report study )
Mass Media, Magazine Influence Continue Declines Only 18% of U.S. consumers cite magazines as a source of information they have consulted in the last month, down from 23% in 2006, according to recent research from Ketchum Public Relations. Trade magazines and newsletters showed only a slight decline, from 13% to 12% over the past two years. The periodical world is not alone in this steady erosion of mass media authority. In its study of traditional media usage, Ketchum also found that national TV declined as an information source, from 71% in 2006 to 65% in late 2008, local TV news fell from 74% to 63% and local newspapers went from 69% usage to 63%. The only old-school mass medium that enjoyed a gain was cable network news, which climbed from 47% of use in 2006 to 49% last year. Peer-to-peer authority is replacing mass media on all fronts. As information sources, family and friends’ advice rose from 44% to 47% as an information source, while coworker advice went from 23% to 30%. The flight from top-down authority in the information value chain is clearest in online usage. Virtually every P2P category of interactivity, most notably blogs and social networks, exploded in their use and influence, the 1,000 U.S. respondents in this survey showed. (source)
Consumer Usage of Online Media (% of U.S. Consumers Using) 20062008 61%59% 40%42% 38%31% 17%26% 22%26% 13%24% 17%35% 6%11% 5%7% 7%9% 8%8% 5%7% 5%6% Email Newsletters Cable TV News Sites Social Networking Sites Company Website Blogs Shopping Sites Videocasts Podcasts Company Emal Blasts Business News Sites RSS News Feeds Mobile Media
Source: Ketchum Global Media Network and Global Research Network partnered with the University of Southern California Annenberg Strategic Public Relations Center on this study. |
What we do with our mobile phones? According to comScore Mobile, a higher percentage of users in the 13- to 24-year-old group compared with the older group use their phones for services like texting. (Source: NYT 1/21/09) Service 13-24 25-52 Sent text message 57% 28% Sent email 11 9 Took photos 14 5 Used I.M. service 9 4 Used photo/video network 9 4 Sent photo to a phone 8 3 Sent photo to a pc 6 2 Sent photo via email 5 3 Captured video 5 2 Uploaded photo to Web 4 2
Older adults among newer members on social networking sites (Pew Study)
Although the share of online adults with a profile quadrupled from 8% in 2005, Pew found that the young are still more likely to use these sites. Among 18-24-year-olds, 75% of those who go online have a profile.
-
-
-
-
-
-
- 75% of online adults 18-24 have a profile on a social network site
-
-
-
-
-
-
-
-
-
-
- 57% of online adults 25-34 have a profile on a social network
-
-
-
-
-
-
-
-
-
- 30% of online adults 35-44 have one
-
-
-
-
-
-
-
-
-
- 19% of online 45 to 54 year olds have a profile
-
-
-
-
-
-
-
-
-
- 10% of online 55 to 64 year olds have a profile
-
-
-
-
-
-
-
-
-
- 7% of online adults 65 and older have a profile
-
-
-
-
(Sources: USA Today; Social Computing Magazine, link to study)
State of Media Democracy 2009 Survey Reveals millennials view their computer as more of an entertainment device rather than their TV The study found that millennials, or Generation Y, watched the fewest hours of television per week. They averaged only 10.5 hours per week. In comparison, Generation X watched 15.1 hours, baby boomers watched 19.2 hours and seniors watched 21.5 hours. While the numbers may seem odd for a generation that is notorious for its technological savvy, the study found that millennials spent the most amount of time watching DVDs on the computer and also the most time playing video games, listening to music and surfing the Internet. (Source: News story/ Deloitte PR) The State of The Media Democracy study: Young people watch less TV –“millennials,” the generation of ages 14-25, watch just 10.5 hours of TV a week – Generation X (ages 26-42) watches 15.1 hours, – Baby boomers (43-61) watch 19.2 hours – and 21.5 hours for matures (62-75). – 33% of respondents owned a DVR – millenials spend less time watching DVDs of movies and TV shows on television sets, 4.8 hours a week, than do Gen Xers. They are, though, spending more time watching DVDs on a computer — 1.9 hours a week — than any other age group. – Millennials spend an average of 1.8 hours a week at the movies, while it’s just one hour for Gen Xers, 0.9 hours for Boomers and 0.7 hours for Matures. (Sources: Reuters/New Tee Vee/Hollywood Reporter/Adweek; details of the new study; link to 2007 study)
CISCO’s Worldwide Media Survey Released
-
-
-
-
-
-
- U.S. consumers watch the most TV: an average of 3.8 hours per day. Germans watched 2.9 hours on average; Swedes, 2.1 hours; and urban Chinese, 1.8 hours.
-
-
-
-
-
-
-
-
-
-
- Urban China has the largest percent of users who watch online video via their PCs, at 97 percent, with the U.S. following at 81 percent.
-
-
-
-
-
-
-
-
-
- The U.S. has the largest percentage of users watching video on a mobile phone, at 23 percent.
-
-
-
-
-
-
-
-
-
- U.S. respondents who watch video on their mobile phone spend an average of 36 minutes per day doing so.
-
-
-
-
-
-
-
-
-
- Eighty-five percent of the German respondents are interested in viewing Internet video on their TV sets, compared with 55 percent of Swedes, 54 percent of Americans, and 35 percent of urban Chinese.
-
-
-
-
-
-
-
-
-
- U.S. respondents watch 2.5 times as much professional video content (TV programs and movies) as they do user-generated video content on their PC or laptop. German respondents watch twice as much user-generated video on their PC or laptop as they do professional video content.
-
-
-
-
-
-
-
-
-
- On average, American respondents who use a PC or laptop to view video spend 1.5 hours per day doing so. They are well ahead of the Swedes (who spend 0.7 hours per day), equal to the Germans (1.5 hours per day) and slightly below the Chinese (1.9 hours per day). (Source: CISCO PR; see also World Internet Project International Report)
- On average, American respondents who use a PC or laptop to view video spend 1.5 hours per day doing so. They are well ahead of the Swedes (who spend 0.7 hours per day), equal to the Germans (1.5 hours per day) and slightly below the Chinese (1.9 hours per day). (Source: CISCO PR; see also World Internet Project International Report)
-
-
-
-
Social Networking’s Growth
Youth and Online Gaming Virtual Worlds
• 34 percent of American children and teens who use the Internet visited a virtual world at least once a month in 2008. That’s expected to rise to 42 percent in 2009. • 71 percent of digital kids feel their virtual worlds are very important to them. • 13 percent of adults say their children are spending less time with real friends and more with virtual ones • 75 percent of youngsters said in a survey that they use the Internet to participate in communities tied to social causes. • Virtual worlds like Elf Island, World of Warcraft, Ultima Online, Second Life, Webkinz and scores of others allow players to interact with others worldwide. They are known as “massively multiplayer online games.” • About 10 million people worldwide visit at least one virtual world often. • A new three-year study funded by the MacArthur Foundation concludes that youngsters who play online are acquiring technical skills and “learning to be competent citizens in the digital age.” • A survey found that digital kids have a hankering to “make a difference” and help the planet Sources: University of California-Irvine, Center for the Digital Future of University of Southern California, Media Research Lab of Iowa State University, Just Kid Inc. (found in AJC story, Jan 2009)
What do we know about blogs/bloggers?
-
-
-
-
-
-
- U.S. bloggers = 57 percent male (parity is near);
-
-
-
-
-
-
-
-
-
-
-
- One in four bloggers spends 10 hours or more blogging each week
-
-
-
-
-
-
-
-
-
-
- 77 percent of the bloggers surveyed comment on other blogs
-
-
-
-
(Source December 1 post)
Who is playing videogames? Adults The Pew Internet & American Life Project – which in September 2008 revealed that 97% of kids play videogames – has now (December 2008) found that more than half of American adults (53%) play computer games, with one in five (21%) playing every day. In particular, men and “urbanites” are more likely to play than women and “rural-dwellers.” (Source/link to Study)
Nielsen Study: Media Use Grows On All Fronts the average person in the U.S. watched 142 hours of TV a month, up 4% from last year. People who used the Internet were online 27 hours a month, up 6%, and those who watched video on mobile phones watched three hours a month, unchanged compared with a year ago. — DVR use is significant: Americans spend more than six hours a month watching DVR-timeshifted TV, more than double the amount of time they watch video online. — Men are more likely than women to watch video on mobile phones, but women are more likely than men to watch video on the Internet. — Online video use grew steadily through the quarter when there were major events including the Olympics, Major League Baseball games, the political conventions and debates, and the financial crisis. (Source; Full Report: Americans Can’t Get Enough Of Their Screen Time)
Only 88% of US Youth Have Internet Access
While some 88 percent of young Americans have access to the Internet, that figure is far behind Internet access for youngsters and teens in other countries. For instance, 95 percent of Canadian youth have Internet access; the Czech Republic and Macao come in at 96 percent, Israel at 98 percent. And the winner? Apparently 100 percent of young Britons have access to the Internet. The U.S. also trails Sweden, New Zealand, and Canada in Internet usage by citizens over 18 years old. (Source)
Internet Popularity In 1995, when The Harris Poll(R) began measuring online activity, less than 18 million adults used the Internet in their homes, offices, schools, libraries or other locations. Now, thirteen years, later, fully 184 million adults are online. While most people (75%), and almost all those use the Internet, use it at home, more than two out of five adults (43%) go online at work and a third (32%) do so at other locations (schools, cybercafes, libraries, etc.) (Source)
DVR — USE ESCALATES Even though digital video recorders are installed in the homes of only 28 percent of the country, twice the number of people are using them for time-shifted viewing than used VCRs when they were present in 90 percent of U.S. homes, according to a study by Interpublic Group’s (IPG) Magna Global. The study also discovered that DVR viewing accounts for 11 percent of all household viewing — rising to 16 percent among the 18-49 age group. (Source)
Nielsen finds strong TV-Internet usage overlap
Average TV viewership still dwarfs online activity in the home — 127 hours vs. 26 hours per month among those who use the Internet, with video “streaming” on the Web accounting for just two hours and 19 minutes. As a group, teen girls are the most likely to engage in streaming, 82 percent. While 31 percent of in-home online activity occurs at the same time the user is watching TV, the lion’s share of all household TV viewership — almost 96 percent — takes place apart from the Internet, the Nielsen study found. Not surprisingly, perhaps, a higher percentage of teenage TV viewing coincides with Internet use, 5.4 percent compared with 3.8 percent for the general population, Nielsen found. (Source: Yahoo News: 10/31/08)
Popularity of Online Video
a study by Ipsos Media found that about 54% of female Internet users ages 12 and up have streamed a video online in the past 30 days, up from 45% a year ago. That’s an all-time high and nearly equal to the 58% of men who have streamed online video in the past month. Ipsos also reported that 60% of adults 35 to 54 have recently streamed online video, up from 49% in late 2007 (Source)
Price of a 30 second ad in network TV the average cost for a 30-second commercial in prime time was $130,089 during the 2007-2008 season (source: Adage)
Popularity of Video Games Among the survey’s findings: Ninety-seven percent of young respondents play video games. That’s 99 percent of boys and 94 percent of girls, with little difference in the percentages among various racial and ethnic groups and incomes. In fact, 7 percent of those surveyed said they didn’t have a computer at home, but did have a game console, such as Sony Corp.’s PlayStation, Microsoft Corp.’s Xbox or Nintendo Co.’s Wii. (Source: Pew Internet & American Life Project )
Podcast Popularity The latest Pew Internet and American Life Project found that 19% of Internet users had downloaded podcasts to listen or view at a later date. A similar study in August 2006 found that just 12% of Internet users had done this. An earlier study of downloading habits, in February and April 2006, found that just 7% of users had downloaded a podcast in this manner, the UK’s Guardian reports. (Source; Source)
Preferring the Web to Watching TV –For children ages 10 to 14 who use the Internet, the computer is a bigger draw than the TV set, according to a study recently released by DoubleClick Performics – 83 percent of Internet users in that age bracket spent an hour or more online a day, but only 68 percent devoted that much time to television. – While 72 percent of the children online belonged to a social networking site (usually MySpace), 60 percent of them said they rarely or never read blogs. (Source)
Up To Age 11, Most Kids Aren’t Heavy Internet Users -While the “vast majority” of 6- to-11-year-olds use the Net, 55% of 9- to-11-year-old boys and 46% of girls in the same age group report using the Internet for less than an hour, or not at all, during the past week. –While TV’s attraction for kids is certainly being diluted by other media, more than 40% of 9- to-11-year-olds watch two or more hours of television on school days. Furthermore, half of the 10 Web sites most popular among 6- to-11-year-olds are sites directly related to television networks. –About 80% of younger kids and 90% of older kids use computers at school, and 75% of younger kids and 85% of older kids use computers at home. One in four girls and one in five boys in the 9- to-11-year-old age group have a computer in their room. Kids are most likely to spend their time on computers playing games. (Source)
Pew Study: TV Remains Top Source of News (August 2008)
Pew found that the largest group of news consumers — 46 percent of those polled — have a “heavy reliance” on television for their news at all times of the day. This group is the oldest, with a median age of 52, and least affluent, with 43 percent unemployed. They are unlikely to own a computer or go online for news. Overall, among those who get some of their news from TV, fewer are watching the 6:30 broadcast network newscasts, and instead opting for cable news sources such as CNN or Fox News Channel. CNN’s audience is now majority Democratic, while 39 percent of Fox News viewers are Republicans, 33 percent Democrats, with the remainder independent or didn’t specify. The group that relies most on the Internet for news is the youngest at a median age of 35. It is also the smallest, at 13 percent of those polled. Fewer than half of them watch television news on a regular basis. Eighty percent of this group has a college education and they are twice as likely to read an online newspaper than a printed version. The emergence of this group and the shift among integrators online led to an overall decline in the percentage of people who said they read a newspaper the day before, to 34 percent from 40 percent two years ago, the researchers found. That is also reflected in a shift in the industry that has seen circulation figures slip in recent quarters. (Source: News Story/Link to full Pew Study) Since 2006, the proportion of Americans who say they get news online at least three days a week has increased from 31% to 37%. About as many people now say they go online for news regularly (at least three days a week) as say they regularly watch cable news (39%); substantially more people regularly get news online than regularly watch one of the nightly network news broadcasts (37% vs. 29%). Since 2006, daily online news use has i ncreased by about a third, from 18% to 25%. Television is still the chief source of news for 46% of the American public. This TV-dependent group was the oldest in the study with a median age of 52 and it was less affluent than groups like the “integrators.” The Pew data was less promising for newspapers. Only 34% told Pew they had read a newspaper the day before. That was down more than 15% from the 40% who read a newspaper just two years before. And Pew had one frightening fact for those who pay close attention to the news business: one-third of people under the age of 25 said they consumed no news on a typical day. (Source: newsletter mediamonitoringnews.com)
Web Searching Rises The percentage of Internet users who use search engines on a typical day has soared from about one-third of all users in 2002, to a new high of just under one half (49%), according to the latest study from the Pew Internet & American Life Project.
Underscoring the dramatic increase over time, the percentage of internet users who search on a typical day grew 69% from January 2002 to May 2008. During the same six-year time period, the use of email on a typical day rose from 52% to 60%, for a growth rate of just 15%. The Pew Internet & American Life Project concluded that these new figures propel search further out of the pack, well ahead of other popular internet activities, such as checking the news (39%) or checking the weather (30%) on a typical day. (Source/link to Pew study)
Half of Adults Text, Blog, Use Other Social Media
-
-
-
-
-
-
- 22% of all American adults say they rely on instant messaging, up from 9% in 2007.
-
-
-
-
-
-
-
-
-
-
- 21% of adults age 18-34 rely on instant messaging, up from 14% in 2007.
-
-
-
-
Only 41% of US adults say they’ve never sent a text message, down 8% from a year ago. Among 18- to 34-year-olds, the proportion of those who have never sent a text message has fallen to 22%, a decline of 16% from last year.
-
-
-
-
-
-
- 10% of US adults now publish blogs. That number was only 5% last year.
-
-
-
-
-
-
-
-
-
-
- Younger Americans publish blogs at twice that rate: Some 20% of US adults age 18-34 publish a blog, up from 10% last year. (Source: Universal McCann’s Media in Mind study)
-
-
-
-
US TV viewers’ average age hits 50 According to a study released by Magna Global’s Steve Sternberg, the five broadcast nets’ average live median age (in other words, not including delayed DVR viewing) was 50 last season. For the just-completed 2007-08 TV season, CBS was oldest in live viewing with a median age of 54. ABC clocked in at 50, followed by NBC (49), Fox (44), CW (34) and Univision (34). (Source: Variety)
US Broadband Study According to Pew’s most recent study, (July 2008) over half (55%) of all Americans now have a high-speed Internet connection at home, up from 47% a year ago. (Source)
Media Habits of African Americans An estimated 68% of black Americans are online, compared to 71% of all Americans, according to a survey from Radio One and research firm Yankelovich. Looking at blacks’ media usage, 84% of housholds have cable and 87% listen to the radio in a given week. On TV, 64% watch news or newsmagazines, 50% watch court shows, 46% watch entertainment shows, and 41% watch sports. Eighty-one percent watch black TV channels, but about 50% of those surveyed said they do not relate to the way black people are portrayed on black-focused TV shows. (Source)
Youth Risk Behavior Survey 2007 details media uses
25% of students used a computer for something that was not school work for 3 or more hours per day on an average school day (see table). This is up slightly from 22% in 2003. (Source)
Americans Consuming More Video Content The (Multiplatform Video Report released by Solutions Research Group) study found that an average American consumer aged 12 and older with Internet access now spends 6.1 hours daily with video-based entertainment, up from 4.6 in 1996. Of this 6.1 hours, 63.9% (nearly 4 hours per day) currently comes from traditional Television, including live, DVR and video-on-demand viewing. Video games, web and PC video, DVDs and video on mobile devices account for the balance. (Source; other details here)
Who Uses YouTube? According to a new study from Nielsen Online, the largest number of tykes and preteens go to YouTube for video (or 4.1 million viewers aged 2 to 11), followed by the Disneychannel.com at a distant second, with 1.3 million viewers in that age bracket for the month of April. MySpace.com, NickJr, and Google Video also showed up on that list. (Source)
Gen Y Media Habits (June 2008) Event Marketing Institute study found:
— 80% of Gen-Yers own three or more personal media devices; — 96% of Millennials go online daily; — For 78% of them, cell phones are the most popular methods of remote communication. (Source)
Still Glued to the Tube Focusing on the 25- to 54-year-old demographic, the Television Bureau of Advertising (TVB) survey found that 53% of their total daily media hours are spent with TV, more than all other mediums combined, and that more of them are reached by TV than other mediums: As much as 90% reported watching TV in the previous 24 hours, as opposed to 80% for radio, 72.1% for the internet, 58.9% for newspapers and 48.3% for magazines. The time spent with TV in the same 24-hour time frame was also significantly higher (222.7 minutes) when compared with radio (106.5), the internet (99.7), newspapers (22.1) and magazines (15.1). Source
Teens Survey of Online/TV Viewing Habits
In -Home Video Game Growth Nielsen released a new study (May 08) that claims that there is at least one video game console in 41 percent of all U.S. households. This is an 18.5 percent increase from the fourth quarter of 2004. The Nielsen study concluded that about 46 million U.S. homes have a console game device in them by the last quarter of 2006. That averages about 150 million people that have access to a video game console. The study further found that two-thirds of men who are between 18 and 34 years of age in television households also have access to game consoles. (Source: “The State of the Console” from Nielsen Wireless and Interactive Services, cited here)
Kids Multitask While Watching TV Excerpts from Grunwald Associates study:
- 50 percent of 9-to-17-year-olds visit web sites they see on TV even as they continue to watch;
- 45 percent of teens have sent instant messages or e-mail to others they knew were watching the same TV show
- One-third (33 percent) of 9-to-17-year-olds say they have participated in online polls, entered contests, played online games or other online activities that television programs have directed them to while they are watching.
( Blog story; press release; blog post)
Watching TV, without the TV A study in October (2007) by Nielsen Media Research found that one in four Internet users had streamed full-length television episodes online in the last three months, including 39 percent of people ages 18 to 34 and, more surprisingly, 23 percent of those 35 to 54. (Source)
Internet Outpacing TV For Time Spent A new study by IDC found that Internet users spent 32.7 hours per week online and about half as much time watching television (16.4 hours). Time spent reading newspapers or magazines accounted for 3.9 hours per week, while overall time spent using all media was 70.6 hours. The most frequent online activities include using search engines (84% of respondents), followed by using navigation services (83%), personal research (77%), and using email (76%). (Source)
Four in Five of All U.S. Adults – An Estimated 178 million – Go Online (Nov. 2007) In research among 2,062 U.S. adults surveyed by telephone in July and October, 2007, Harris Interactive® found that 79 percent of adults are now online. This is a steady rise over the past few years, from 77 percent in February/April 2006, 74 percent in February/April 2005, 66 percent in the spring of 2002, 64 percent in 2001 and 57 percent in Spring of 2000. When Harris Interactive first began to track Internet use in 1995, only nine percent of adults reported they went online. The amount of time that people are spending online has also risen. The average number of hours per week that people are spending online is now at 11 hours, up from 9 hours last year and 8 hours in 2005. (Source)
New Study By Ball State University Examines Daily Media Consumption By Teens (Sept. 2007) The report is available in PDF at www.bsu.edu/cmd/insightandresearch/hsmtoo. Some highlights:
-
-
-
-
-
-
- Classroom has an impact – Type and amount of media use is influenced by classroom environment and workload more significantly than for adults in the workplace. Consequently, future studies should include weekends and vacation time as well as school days.
-
-
-
-
-
-
-
-
-
-
- Concurrent Media Exposure (CME) a factor? – In their free time, teens were frequently found to be using more than one medium. However, constraints in the classroom lowered the overall incidence of concurrent media exposure to levels below those recorded for adults in previous studies.
-
-
-
-
-
-
-
-
-
- Less media time than adults? – Due to lower levels of media consumption in school compared to adults’ media use in the workplace, overall time spent with media for teens in the study was less than previously recorded for adults.
-
-
-
-
-
-
-
-
-
- However, when time out of school is looked at in isolation, teen media consumption achieved and may have exceeded total time spent with media for adults in previous studies.
-
-
-
-
-
-
-
-
-
- It’s all about screens – The dominance of screen-based media, as compared to types among this group when out of school, stands in stark contrast to both overall levels of media use and the presence of print during the school day. Screen-based prime time starts immediately after school and carries on until bedtime. The study also found that levels of activity were observed before the start of the typical school day. (Source: Muncie Free Press)
-
-
-
-
Time Spent With Media The average American consumer spent 3,530 hours with media in 2006–down 0.5% from 2005, according to the just-released estimates from the 21st edition of Veronis Suhler Stevenson’s Communications Industry Forecast. (Aug. 2007: Source)
Social Media Participation Study – in the first survey by the Interpublic Group (2006), a little over half of respondents said they read blogs. Their latest survey (2008) found that over 70% did. – Their first survey found that 30% watched video online, while this year over 80% had – In 2006, less than 30% said they set up a social network profile, while this year over 60% had. – A little over 60% of Internet users in the U.S. said they read blogs, whereas 26% had created one. Over 70% of Internet users blog in South Korea and China, and about 90% of South Koreans read blogs and 88% read blogs in China. (Source)
Podcasting Explosion eMarketer estimates that there was a 285% increase in size of the US podcast audience in 2007, a growth to 18.5 million. (Source)
Global Online Commerce More than 85 percent of the world’s online population has used the Internet to make a purchase – increasing the market for online shopping by 40 percent in the past two years..the most popular and purchased items over the Internet are: – Books (41% purchased in the past three months), – Clothing/Accessories/Shoes (36%), – Videos / DVDs / Games (24%), – Airline Tickets (24%) -and Electronic Equipment (23%). Source: Nielsen Global Online Survey
Kids & Digital Media According to the Kids & Digital Content study, kids are downloading online video clips onto a device 7.1 times per month, followed by music videos at 5.7 times per month, music at 4.2 times per month, games at 3.1 times per month, and ring tones/ring tunes at 2.8 times per month. Playing games is the most prevalent activity on the four key devices – 84 percent are gaming on a computer, video game system, portable digital music player (PDMP) or cell phone – while more than half are listening to music and one-third are communicating with images or interacting with various video formats (Source NPD Group)
“State of the Media Democracy” Deloitte & Touche new media study
Pew “Teens & Social Media” Study some of the highlights: Nearly two-thirds of teens – 63 percent – have a cell phone 35 percent of all online teen girls blog, compared with 20 percent of online teen boys. 32 percent of girls ages 12 to 14 blog, compared to 18 percent of boys age 15 to 17. YouTube and other video sharing sites tend to be the domain of boys. Online teen boys are “twice as likely” as girls to post video files online, by a 19 percent to 10 percent margin. Fully 41 percent of teens who use MySpace, Facebook or similar sites say they send messages to friends via those sites every day. More than half of teens – 55 percent – reported having a profile on sites like MySpace or Facebook, and 42 percent of those teens said they also blog, while 70 percent said they read the blogs (Source: link to study)
Nokia Study of Future of Entertainment Options The study, entitled ‘A Glimpse of the Next Episode’, carried out by The Future Laboratory, interviewed 9000 trend-setting consumers from 17 countries about their digital behaviors and lifestyles signposting emerging entertainment trends. Among the results:
– 17% upload to the internet from a mobile device
Tweens & Mobile Phone Use Some 35% of U.S. “tweens,” defined as kids aged 8-12, own a mobile phone, and 5% access the Internet over their phones each month, according to a new study (Dec. 2007) from The Nielsen Company. The study also found that 20% of tweens have used text messaging, while 21% have used ringtones or ringback tones. Of the 5% of tweens who use their phones to access the Internet, 41% said they did so while commuting or traveling, while 56% did so at home. At home was also where the majority of tweens said they downloaded or watched TV on their phones (58%) or downloaded or played music on their phones (64%).
AOL Latino Study of Hispanic Media Habits Already, 58 percent of Latino consumers own a desktop computer, and there are more than 16 million Latinos online, according to AOL Latino’s latest Hispanic Cyberstudy. The AOL study indicates that Latinos are wired in many ways: 68 percent use instant messaging; 63 percent share photos online; 52 percent read or post blogs; 43 percent visit social networking sites; and 40 percent talk on a phone using the Internet. (Source)
Videogames: Not Just for Males
38% of game players are women. 7.4 hours a week is what the average woman plays (7.6 hours for men). 33 is the average age of game players. 24-35 is the age of women who prefer online games played with other people. 12 is the average number of years a person has been playing video games. 35% of parents play video games with their children; 47% are women. 61% of parents feel that video games are a positive force in their children’s lives. 89% of parents are present for a video-game purchase or rental. 50% of women who register their Wii systems say they’re regular players. Sources: Consumer Electronics Association, Entertainment Software Association, Nintendo of America (as published in Star Telegram story)
Youth Radio and New Media Habits Survey The Paragon Media Strategies online poll of 14- to 24-year-olds found that 73% listen to music on sources other than radio (CDs, mp3s, iPods, streaming, satellite radio, etc.). Even so, radio maintains a 41% share of the younger demo in time listening to recorded music. Other poll findings: females ages 19-24 indicate their use of radio is significantly more than the other three age/gender groups. Listening to music on sources other than radio is more pronounced among younger and male respondents. 44% are listening more, while 40% are listening less to radio than before. iPods and personal mix CD’s were found as the major threats to radio time spent listening (TSL). 78% have iPods, and half of them (49%) are now listening less to radio (18% are listening more). 68% of iPod owners have personalized playlists and are creating their own content. Over three-quarters said they listen to personalized music CDs (mix CDs), and a third of them (32%) are now listening less to radio (19% are listening more). October 2007 Source
Parents Watch More TV Than Their Teenagers –In 2007, female parents age 45-54 will spend 47.6 days watching television. Those who are 35-44 will watch television for 38.3 days. -As for fathers, those 45-54 will spend 40.2 days watching television, and those 35-44 will spend 33.9 days sitting before the screen. -Their teenage children from 13-17 will spend 33.35 days watching television. Source: Integrated Media Measurement, Inc (IMMI))
Latest KFF Study Key results from the Kaiser Family Foundation survey Parents, Children & Media: A Kaiser Family Foundation Survey, (as reported by San Fran Chronicle 6/20/07) Impact of violent and sexual content — 43 percent of parents think violent content contributes a lot to violent behavior in children. — 55 percent think sexual content contributes a lot to inappropriate sexual behaviors. Concerns about media exposure — 51 percent of parents are very concerned that their children are exposed to too much sex. — 46 percent are very concerned that their children are exposed to too much violence. — 20 percent say their children are exposed to a lot of inappropriate content. Concerns about media exposure, by race — 67 percent of black parents, 57 percent of Hispanic parents and 45 percent of white parents are very concerned about their children’s exposure to sex. — 64 percent of black parents, 55 percent of Hispanic parents, and 39 percent of white parents are very concerned about their children’s exposure to violence. Monitoring children’s media exposure — 65 percent of parents said they closely monitor their children’s media use. — 18 percent said they should be doing more to monitor their children’s media use. Concerns about the Internet — 73 percent of parents said they know “a lot” about what their children do online. — 7 percent said they know little or nothing about what their children do online. — 59 percent said the Internet is mostly a positive influence on their children.
Cell phone usage: nearly 16% of US homes have no land lines One in four people aged 18 to 24 had only cell phones, as did 29 percent of those aged 25 to 29, the study showed. The percentages declined with age after that, with 2 percent of those 65 or over having only cell phones. Other findings: -15 percent of Hispanic adults, 13 percent of black adults, 12 percent of Asians and 11 percent of whites had only cell phones; -22 percent of the poorest adults had only cell phones, double the rate for those who are not poor; -13 percent of males and 11 percent of females had cell phones only; -Nearly 2 percent of adults had no phone at all. (Source: CDC’s National Health Interview Survey, quoted in AP news story)
Media use by toddlers One-fifth of infants and toddlers under age 3 have a television in their bedrooms, according to a new study:in the journal Pediatrics: Digital Childhood: Electronic Media and Technology Use Among Infants, Toddlers, and Preschoolers In addition to the youngest group, 43 percent of 3- to 4-year-olds have TVs in their rooms, potentially setting up an unhealthy habit, the authors wrote. (Chicago Tribune)
Explosion in Social Networking: study reveals More than 70% of Americans 15-34 are actively using social networks online The research found that brands such as adidas and Electronic Arts attributed more than 70% of their marketing return on investment to the “Momentum Effect.” Of those polled, 69% said they utilize social networks to connect with existing friends and 41% said they use the sites connect with family members. In addition, the “Never Ending Friending” study revealed that current social networkers spend on average more than seven hours per week on social networking sites, and that those hours are driving the growth of overall time spent online. More than 31% of online social networkers claim they spend more time on the Web in general after starting to use a social network. (Source)
More evidence of teen and pre-teen multi-tasking
Kids between the ages of 2 and 12 years old spend more than a quarter of their leisure time doing two or more activities at the same time. Favorite pastimes among the sample group included reading, using the computer, spending time with friends, listening to music and watching TV. Kids today have plenty of leisure time, with 2-to-11-year-olds averaging roughly 68 hours a week, and 5-to-12-year-olds averaging 58 hours. Toddling 2-to-4-year-olds are true layabouts, averaging 94 hours of leisure time every week. (Source: NPD Group‘s “Kids’ Leisure Time II” report, cited in Emarketer news story)
1 in 3 Americans watch TV away from home: study
One-third of U.S. television viewers watch broadcasts outside their home, a Arbitron
study released April 4 shows, suggesting that a larger audience than thought is tuning into TV at bars, work, at a friend’s house or the gym. The Internet, portable music players and other types of new media have widened the entertainment choices for Americans, creating competition for the $70 billion in advertising money the TV industry attracts a year. By age group, 64 percent of 12-17 year olds watched TV away from home at least once per week; 49 percent of 18-24 year olds watched away from home; and about 23 percent of those aged 55 and older watched away from home. Of all respondents, more watched TV in someone else’s home than anywhere else, at 25 percent. By comparison, 11 percent watched at a restaurant or bar and 7 percent at work. (Source: Reuters)
YOUTH EXPOSURE TO ADS ON TV Kids 8-12-years old see an average of 21 food ads a day–more than 7,600 a year– most of which are for candy and snacks (34%), cereal (28%), and fast food (10%). (Source BC News; March 2007-Kaiser Family Foundation study)
WHO HAS INTERNET AND WHO DOES NOT According to a new study from Park Associates, a technology market research company in Dallas, 29 percent of U.S. households have no internet service provider and no plans to get one. (Source)
NIELSEN RESEARCH ON TV — USE There are an average of 111.4 million TV homes in the United States for the 2006-07 TV season. The average U.S. TV home has 2.5 people and 2.8 television sets. 28% of U.S. TV homes have digital cable. 64% of homes have wired cable hook-ups (down from 68% in 2000) and 23% have satellite or specialized antenna systems to receive television signals. 82% of U.S homes have more than one television set at home. 84% of U.S. homes have a DVD player. (Source)
VIDEO GAME USAGE More than one in three U.S. adults who go online, or 37 percent, own a video game console and 16 percent own a portable gaming device (Source Nielsen//NetRatings)
MEDIA HABITS OF CHILDREN AGE 6-11 * Forty percent of MP3/Digital Media Player owners reported owning Apple’s iPod * 975,000 have visited/used MySpace.com in the last month * 2,376,000 have downloaded music online in the last month * 1,367,000 have written or read an online journal/blog in the last month * Fifty-four (54) percent (or 13,078,000) have a television in their room * Twenty-six (26) percent (or 6,263,000) have a stereo in their room * Nineteen (19) percent (or 4,658,000) have a computer in their room (Source: Fall 2006 National Kids Study; additional details)
TWEEN MEDIA HABITS An annual survey by Solutions Research Group for YTV, showed that tweens – kids ages 7 to 12 – spend 45% of their media time watching TV, 14% on the Internet, 12% on video games, 11% on music, 11% on radio, 6% on DVDs and 1% on cell phones. Kids watch about 17 hours per week of television, according to BBM Nielsen Research. Although tweens are spending 14% of their media time on the Internet, teens ages 12 to 19 spend 25% of their media time on the Internet. (Source)
INTERNET: MORE INFLUENTIAL THAN TV/MAGAZINES? 50 percent of broadband users in the U.S. say a recent purchase was influenced by the Internet, 36 percent were influenced by shopping sites and 15 percent by search engines. This was more than TV commercials (11 percent) and magazine advertisements (6 percent), showing the growing impact of online sources on purchasing decisions, as revealed in Netpop | Shop, a recent study by Media-Screen, a market research firm that focuses on online consumer trends. (Source)
SOURCES OF POLITICAL NEWS The Internet still trails television and newspapers as the leading sources for political news, but it gained significantly in usage since the midterm elections of 2002, the Pew Internet and American Life Project found. The study, released 1/17/07, revealed that 69 percent of Americans cited television and 34 percent considered newspapers their leading choices for news; survey respondents could specify their top two. Radio and the Internet each got about 15 percent, while magazines had 2 percent. Even among online users, the Internet was a leading source for only 22 percent. It rises to 35 percent for high-speed Internet users under age 36. (Source: AP)
PEW STUDY ON TEEN INTERNET — USE In the ever-growing field of MySpace-Facebook-teenager data analysis, the Pew Internet & American Life Project released a survey January 7, 2007 that finds 55 percent of all teenagers online use social networking sites. The Pew survey found that 70 percent of teen girls, ages 15 to 17, had profiles on social networking sites, compared with 57 percent of boys in that age bracket.
DVDs OVERTAKE VCRS IN HOMES 81% of households now own a DVD player, while just over 79% have a VCR, according to Nielsen Media Research’s third-quarter (2006) home technology report. Nielsen’s survey also showed that 73%of homes currently have a computer, while nearly 27 % of homes rent or own an MP3 player and more than 16% of homes own a PDA. Households with children or teens are more likely to own a computer, and those homes with children ages 12 to 17 are two and a half times likely to own or rent an MP3 player. (Source AP; link to report)
2007 MEDIA HABIT PREDICTION It turns out that in 2007, American adults and teens will spend an estimated 3,518 hours – or nearly five months each – plus $936.75 per person consuming media. Predictions:
Those numbers are provided in a communications industry forecast that is included in the U.S. Census Bureau’s Statistical Abstract of the United States: 2007: “Media Usage and Consumer Spending: 2000 to 2009.” (Source)
GENERATION M MULTI TASKING STUDY (KAISER) A new (Dec. 2006) study from the Kaiser Family Foundation says that teens and kids do there fair share of media multitasking. One area that sees the least multitasking is TV. 55 percent of the time teens are not multitasking while watching TV. The same goes for video games. The activity that has the most multitasking involved is e-mail. When using e-mail they are multitasking nearly 80 percent of the time. (Source)
BROADBAND — USE: POPULAR AT HOME More than three-quarters of residential Web users got on the Internet using a high-speed broadband connection in November 2006, according to a study released December 11. The 78 percent broadband penetration rate for U.S. homes represents a jump from 65 percent a year earlier, Nielsen/NetRatings found. The research company said broadband users spent 33 percent more time online than dial-up users _ nearly 35 hours for the month, compared with 26 hours and some change for dial-up. Broadband users also viewed twice as many Web pages. Games, instant messaging, e-mail and social networking were among the leading activities among high-speed users. (Source)
GEN X, Y MEDIA HABITS In a Forrester Research study of North American households’ media habit, Gen Xers (age 27-40) reported spending more time per week watching TV than using the Internet, 11.2 hours vs. 9.5. Among Gen Yers (age 18-26), Internet time exceeded TV time, but by a relatively modest margin (12.2. hours vs. 10.6). (Source)
TRACKING AUDIENCE GROWTH FOR PODCASTS Twelve percent of Web users surveyed in August said they have downloaded a podcast–up from 7% who said the same in a survey conducted between February and April. Those numbers appear higher than what was reported in July by media measurement company Nielsen//NetRatings, which found that 6.6% of U.S. adult Web users had downloaded a podcast in the last 30 days. (Source: Pew Internet & American Life Project )
TV WATCHING VIA THE COMPUTER One out of every 10 online consumers is watching television shows on a computer, according to a report released October 25. (Source: The Consumer Internet Barometer, produced by The Conference Board )
RTNDA FUTURE OF NEWS STUDY
The study, conducted by Prof. Bob Papper at Ball State University, included a sample of 1,000 adults — half under the age of 25. Only 3% said they read a blog daily; only 5% have watched news on a small screen. Papper said 40% of the TV news directors thought small screen gizmo-viewing was common. Source: Marketwatch
TEENS TUNE INTO NEWS ON THE INTERNET, KNIGHT FOUNDATION STUDY SHOWS
66 percent of high school students get their news and information from the news pages of Internet portals such as Google and Yahoo!, 45 percent from national TV news web sites, 34 percent from local TV or newspaper web sites, 32 percent from blogs and 21 percent from national newspaper sites. 45 percent of high school students say TV provides the most accurate news; 23 percent say newspapers, and 10 percent say blogs 46 percent of students get news and information at least once a week from entertainment shows such as The Daily Show, The Colbert Report and South Park. 31 percent of high school students post comments on blogs or online columns at least once a week. Only 10 percent of teens say they are not at all interested in the news, mostly because they feel it isn’t presented in an interesting way. Nine of 10 teens are wired to the Internet through school and eight in 10 through the home. (Source: www.firstamendmentfuture.org.)
US Has More TVs Than People ( AP, Sept, 22, 2006 ) NEW YORK (AP) – Televisions have taken over the average American home. Nielsen Media Research says the average home in the U-S now has more television sets than people to sit down and watch them. The researchers say there are now two-point-73 T-V sets in the typical home, compared to just two-point-55 people. Nielsen says half of American homes now have three or more T-Vs, while only 19 percent have just one. In 1975, 57 percent of homes had only a single set. Nielsen also says more people are watching more television, as sets are turned on for more than eight hours a day in the average home. The average person watches for four hours and 35 minutes of television each day. (Source: AP; Nielsen)  More than 50% of homes have at least three working televisions. USA average: 2.8. (Frank N. Magid Associates/By Tracey Wong Briggs and Gia Kereselidze, USA TODAY)
TV Viewing Continues to Rise The total average time a household watched television during the 2005-2006 television year was 8 hours and 14 minutes per day, a 3-minute increase from the 2004-2005 season and a record high. The average amount of television watched by an individual viewer increased 3 minutes per day to 4 hours and 35 minutes, also a record. Meanwhile, during primetime, households tuned to an average of 1 hour and 54 minutes of primetime television per night, up 1 minute, and the average viewer watched 1 hour and 11 minutes, which was the same as last year.
Although teenagers typically drive the consumption and development of new media platforms, teens age 12-17 viewed 3% more traditional television during the full day than in the 2004-2005 television year. This increase was driven primarily by teenage girls, who increased their Total Day viewing by 6%. Increases among teenage girls were particularly high during early morning (6:00 a.m. to 9:00 a.m.) and late night (11:30 p.m. to 2:00 a.m.) viewing, which were up 12% and 6%, respectively. Younger children age 2-11 also watched more television during 2005-2006, increasing their total day viewing levels by 4%. Viewing by children increased 3% during primetime, 5% during early morning and 6% during late night. During 2005-2006, African American and Hispanic Total Day persons’ viewing levels increased 4% and 3%, respectively, with significant increases among children and teenage girls. African American viewing among children age 2-11 and teen girls age 12-17 increased 10% and 9%, respectively, while viewing among Hispanic children and teenage girls increased 14% and 6%, respectively. (Source; Nielsen)
# of Commercials in Prime Time (September 2006) The average hour of prime-time broadcast network programming contained two minutes and 51 seconds of in-show brand appearances in the second quarter, according to TNS Media Intelligence. On top of that were 18 minutes and 12 second of commercial messages. That means to about 35 percent of each prime-time hour contains marketing content. Source
Nielsen Revises TV Market Sizes Based on Homes With Television (August 2006) The total number of television households within the U.S. (including Alaska and Hawaii) is now estimated at 111.4 million, an increase of 1.1 percent since last year, according to Nielsen Media Research. These estimates, which are projected to January 1, 2007, will be used for the entire 2006-2007 television season. Nielsen today also reported many shifts in local market rankings, in large part because of more people migrating to the Southern and Western regions of the U.S., as well as a significant shift in New Orleans. (Full report including list of TV markets can be found here)
Major Study of Online Users Gen Yers spend 12.2 hours online every week — 28 percent longer than 27- to 40-year-old Gen Xers and almost twice as long as 51- to 61-year-old Older Boomers. Gen Yers are also much more likely to engage in Social Computing activities while online. For example, they are 50 percent more likely than Gen Xers to send instant messages, twice as likely to read blogs, and three times as likely to use social networking sites like MySpace. Other results: — Forty-one percent of North American households now have broadband Internet access at home — up from 29 percent at the end of 2004. — Seventy-five percent of North American households have mobile phones, and almost half of them make the bulk of their long-distance phone calls on these mobile phones. — Forty-five percent of Gen Yers, 27 percent of Gen Xers, and 17 percent of 41- to 50-year- old Younger Boomers who have a mobile phone use it for data services, led by text messaging, ring tones, and games. — Cross-channel shopping continues to grow. Gen Yers, for example, are 73 percent more likely to research online and shop offline today than they were in 2004. — Ninety-one percent of online households use a search engine once a week or more. For online Gen Yers and Gen Xers, Google attracts 62 percent of searchers, and 25 percent limit their searches to only Google. — Seventy-eight percent of online Gen Yers and 61 percent of online Seniors aged 62 and up book or research travel online. (Source: July 2006 North American Consumer Technology Adoption Study 2006 Benchmark Survey)
Podcasting Popularity
6.6% of the U.S. adult online population, or 9.2 million Web users,

have recently downloaded an audio podcast; 4.0 %, or 5.6 million Web

users, have recently downloaded a video podcast. These figures put the podcasting

population on a par with those who publish blogs, 4.8 %, and online daters, 3.9 %.

However, podcasting is not yet nearly as popular as viewing and paying bills online, 51.6 %,

or online job hunting, 24.6 %. (July 2006, Nielsen/Net Ratings Source)
Spending Habits of Teens Teenagers spent over $158 billion in 2005 and are predicted to spend $205 billion in 2008. (Source)
Conference addresses problems of children and unmonitored media (June 2006) (Story; New America Foundation; Family Media Safety Guide; UPI )
Common Sense Media Poll on Parents, Kids & Internet Use (June 2006) • 85% of Parents say the Internet is the most risky for kids compared to 13% for TV • 91% of Parents say that the Internet helps their kids explore things they’re passionate about • 77% of Parents say they see the Internet as an important tool to help their kids learn • 80% of Parents worry about predators in their kids’ Internet use • 76% of Parents say they would like to make the Internet a safer place for kids • 83% of Parents say There is no excuse for not knowing enough about the Internet to protect your kids or teens • 88% of parents think it’s more important to know what their kids are doing online than to respect their kids’ privacy • 87% of parents seek out information about their kids’ Internet use a few times a month (Source)
Study: More and More Children Using Consumer Electronics
TV DOMINATES MEDIA USAGE (April 2006) According to a TVB study of 1,183 people in January, which was released at TVB’s annual marketing conference in New York, adults spent an average of 264.5 minutes per 24 hours watching TV, compared to 125.5 minutes for radio, 85 for the Internet, 20 for newspapers and 16.3 with magazines. The study found that TV advertising is the most influential, with 81.8% naming TV. Newspapers were next at 62.2%, but the Internet was also strong, just behind print at 59.8%, ahead of magazines at 51%. On the news front, broadcast TV won out again, cited as the primary source by 43% or respondents, compared to 23.8% for cable news networks. Broadcast TV also scored points for public service, named as the most involved in their community by 54.3%. Newspapers were second at 25.9%. Cable news networks were named by 6.3%, and only 2.7% named public TV stations. (Source: Broadcasting & Cable)
ACCESSING NEWSPAPERS ONLINE GROWS A study being released April 3, 2006 by the Newspaper Association of America, a trade group, found that one in three Internet users — 55 million — visit a newspaper website every month. Also, unique visitors to newspaper websites jumped 21% from January 2005 to December 2005, while the number of page views soared by 43% over the same period. (AP, via USA Today)
WATCHING VIDEO ONLINE 24% of Internet users access video at least once a week, while 46% watch video at least once a month. News leads the way in frequency of viewing, with 27% of online video viewers watching at least once a week, followed closely by funny videos (26% watch at least once a week). Online video viewing is very common at home (39% of those with home Internet access watch at least once a week) compared to 19% of those who watch at least once a week at work, according to Online Publishers Association.
TIME SPENT USING HOME COMPUTERS The average person now (2006) spends 30.5 hours per month using their home computer; two years ago (2004) the average person spent only 25.5 hours at their PC each month. (Study by Nielsen/NetRatings: http://www.adage.com/news.cms?newsId
LOCAL NEWS DRIVES NEWSPAPER READERSHIP A new survey (by the market research business Outsell Inc.) finds that 61% of consumers look to their newspapers as an essential source for local news, events and sports, followed by television (58%) and radio (35%). Seventy-one percent of respondents say they rely on network, cable and satellite TV for national news. Source: News Story Link to full study
NEWSPAPER ADULT READERSHIP UP? (If you count online…)  Source: http://biz.yahoo.com/ibd/060217/managing.html?.v=1
TRADITIONAL TV VIEWING STILL DOMINATES TIME According to a recent FCC report, Americans spend close to 30 percent of their day engaged in some activity involving media, with television viewing being the dominant media activity. From September 2004 to September 2005, the average household tuned into TV for eight hours, 11 minutes per day. But the report also said that while TV consumption is growing, cable subscribership has declined slightly in the past year. Cable’s share of the video market is approximately 69.4 percent, but that is down from almost 71.6 percent a year earlier. (Source)
MAGAZINES, OTHER MEDIA & MULTI-TASKING According to a new study from Ball State University’s Center for Media Design, consumers paid significant attention to magazines when used in conjunction with radio, TV, and the internet. Newspapers ranked second. Nearly half of all magazine consumption takes place with the TV on, as well, while more than half – 51.6 percent – of all newspaper time takes place with the TV on. Magazines also show heavier readership on Mondays and Fridays, while newspaper readership is highest on Sundays. TV, radio, and internet exposure is lowest on weekends. Source: MediaBuyerPlanner 2/06/06; Link to study:here Other findings from the study:
-
-
-
-
-
-
- TV dominates in the home, radio is the main medium in the car and computer usage is common both at work and home.
-
-
-
-
-
-
-
-
-
-
- Magazines are the medium with the largest proportion of time used at “other” locations, which is due, in part, to print publications found in public places where people wait for service.
-
-
-
-
-
-
-
-
-
- Most people read newspapers in the morning.
-
-
-
-
-
-
-
-
-
- TV dominates as a news source in the early morning; up to 70 percent of participants watch television in the evenings. The study also found that, when using more than one medium at once, consumers paid significant attention to magazines. Newspapers ranked a distant second, but held a substantial lead in attracting attention relative to the Internet, radio or television when more than one medium was used.
-
-
-
-
-
-
-
-
-
-
AGE OF INTERNET — USERS Age Pct of Americans In Age Group Online 12-17 87% 18-24 82% 25-29 85% 30-34 83% 40-44 76% 45-49 73% 50-54 68% 55-59 68% 60-64 55% 65-69 57% 70-75 26% 76+ 17% (Source: Wash Post 2/6/06 quoting Pew Internet & American Life Project surveys conducted Oct.-Nov. 2004 (teens) and Jan.-June 2005 (adults)
ONLINE CONSUMERS SPEND AS MUCH TIME ONLINE AS IN FRONT OF THE TV According to a new report entitled: “U.S. Entertainment and Media Consumer Survey, 2005,” authored by JupiterResearch Analyst Barry Parr, the average online consumer spends 14 hours a week online, which is the same amount of time they watch TV. Source: http://www.jupitermedia.com/corporate/releases/06.01.30-newjupresearch.html
New study reveals more multitasking The new white paper “Engaging the Ad-Supported Media” reveals: • Television dominates in the home, radio is the main medium in the car and computer usage is common both at work and home. • Magazines are the medium with the largest proportion of time used at “other” locations, which is due, in part, to print publications found in public places where people wait for service. • Most people read newspapers in the morning. • Television dominates as a news source in the early morning; up to 70 percent of participants watch television in the evenings. • Magazines show heavier readership on Mondays (29.1 percent) and Fridays (34.7 percent), newspaper readership peaks on Sundays and television exposure is lowest on the weekends. • Participants were observed using all five ad-supported media while involved in everyday life activities. For example, for time spent with television, the top three non-media activities — eating, housework, and work — were relatively equal, together occupying about 19 percent of TV viewing minutes. • Radio maintained its reputation as a classic background medium, with participants listening as an exclusive activity only 24 percent of the time. • Almost half of all magazine exposure is experienced with television in the background, while television is the highest-ranked partner for newspapers by average minutes (51.6 percent of all newspaper time). Source: http://www.newswise.com/articles/view/517630/ and http://www.bsu.edu/cmd/insightresearch
Video game users statistics New survey by Entertainment Software Association and conducted by Peter D. Hart Research Associates, showed that the typical “gamer parent” is 37 years old, has been playing video and computer games for an average of 13 years, and spends 19 hours each month on the activity. The survey showed that 35 percent of U.S. parents play video and computer games. Of those, 80 percent play video and computer games with their children, and 66 percent believe playing the games has brought their families closer together. (Source: News story)
Popularity of Blogs A study by the Pew Internet and American Life Project ( www.pewinternet.org ) that by the end of 2004, about 8 million people had created a blog. Source: news story
Internet Use 2005
The year 2005 showed the most Internet use to date with 78.6 percent of Americans going online with the average weekly usage rising to 13.3 hours. In 2000, 46.9 percent of users reported that they use home Internet access. This number increased to 66.2 percent in 2005, according to the study.Once the main portal to the Internet, the telephone modem is no longer the most common type of Internet connection. Only 45.6 percent of users reported that they access the Internet via a telephone modem, down from 61.5 percent in the previous study. Users accessing the Internet via a Broadband connection are currently at 48.3 percent and continue to increase. Source: Fifth USC Study of the Internet by the Digital Future Project. quoted in http://news.tmcnet.com/news/2006/jan/1277873.htm
AVERAGE Time spent watching TV (Fall 2005 vs Fall 2004) 4:39 (Four hours 39 minutes) the average time a person spent watching TV each day this Fall 4:35 (last fall) (Source: NY Times, 1/9/06)
Music Listening Preferences 85 percent of the 2,000 teen-to-twenty-somethings interviewed claimed they would choose to listen to music from their MP3 players rather than traditional radio. 54 percent said they’d prefer to listen to music over the Internet as compared to the 30 percent who chose AM/FM. And 31 percent were exposed to new music over the radio versus 72 percent who found that new music on the Internet. (Source: 12/8/05 “How to Make Music Radio Appealing To The Next Generation” USC MediaLab)
10th Annual Videogame Report Card
-
-
-
-
-
-
- 87% of 8- to 17-year old children play video games at home. More than nine out of ten (92%) boys play video games at home, while 80% of girls say they play at home.
-
-
-
-
-
-
-
-
-
-
-
-
-
-
-
- Less than half (47%) of children say their parents understand all of the ESRB ratings.
-
-
-
-
-
-
-
- Only 26% say that a parent has ever stopped them from getting a video game because of its rating (28% boys, 23% girls).
-
-
-
-
-
-
-
- Seven out of 10 children report playing M-rated games.
-
-
-
-
-
-
-
- There are vast differences between boys and girls, with 86% of boys admitting that they play M-rated games compared to 49% of girls.
-
-
-
-
-
-
-
- Almost two-thirds (61%) of children report owning their own M-rated games, up from 56% in 2003. 78% of boys say they own M-rated games.
-
-
-
-
-
-
-
- Almost half of children (45%) say they have bought M-rated games themselves (up from 37% in 2003).
-
-
-
-
-
-
-
- Only 55% of children said a parent was present the last time they bought an M-rated game (down from 65% in 2003).
-
-
-
-
-
-
-
- Almost two-thirds (60%) of children list at least one M-rated game as their favorite (75% of boys and 35% of girls). Source: http://www.mediafamily.org/research/report_vgrc_2005.shtml
- Almost two-thirds (60%) of children list at least one M-rated game as their favorite (75% of boys and 35% of girls). Source: http://www.mediafamily.org/research/report_vgrc_2005.shtml
-
-
-
-
-
-
-
- American Kids Study 2005 Gaming is the top online activity. CD players outnumber MP3 players for music listening 70% want to make a lot of money when they are older. When asked what they do when TV commercials come on, nearly 60% of respondents say they watch them. Source: http://www.mediamark.com/mri/docs/press.html More from this study: more than half said they listen to music on CD players more than MP3 players, and that most (74%) listened to music most often on car radios. Surprising to me, only 4.1% said they listen on an MP3 player, though I’m sure this number is going up as MP3 players get cheaper and cheaper. Source: http://www.businessweek.com/the_thread/brandnewday/archives/2006/01/kids_dont_skip.html
Video game users According to a soon to be released study of 4,000 adults and 1,000 teens conducted online for Jack Myers Media Business Report, 62 percent of all males and 47 percent of all females played video games either on consoles or online in the past week. Males spent an average of one hour and six minutes daily and females 42 minutes daily. Eighty percent of males 18-24 played video games in the past week as did 55 percent of females 18-24. Among teens, 71.5 percent of all males and 47.7 percent of all females played video games either on consoles or online in the past week. Males spent an average of one hour and 54 minutes daily and females an average of 36 minutes daily. Source: http://www.adrants.com/2005/11/gaming-medium-growing-in-pervasiveness.php
African Americans & TV According to Nielsen Media Research, the television is on in the typical African-American home 11 hours, 10 minutes a day, compared with 7 hours, 34 minutes in white homes. Nielsen translates that to about 79 hours a week of TV in black homes compared with about 52 hours in white homes. On average, black children watch nearly two hours more television a day than white students, which translates to 14 hours a week that black students could be reading or doing homework. (Source: Boston Globe Op Ed by Derrick Z. Jackson, November 6, 2005)
Youth media use Sixty nine percent of kids 6-14 have TVs in their bedrooms, according to Nickelodeon’s “U.S. Multicultural Kids Study 2005.” That’s compared to 49% who have videogame systems in their bedrooms, 46% who have VCRs, 37% who have DVD players, 35% who have cable or satellite TV service, 24% who have PCs and 18% who have Internet access…….The high percentage of TVs in kids bedrooms comes at a time when Nielsen is reporting the highest levels of TV viewing among kids in more than 20 years. Through Oct. 9, 2005, kids aged 6-11 watched 23 hours and 3 minutes a week, according to Nielsen. That’s compared to 21 hours and 18 minutes in 1992. Source: http://www.progress.org/2005/tv02.htm
Teen blog users revealing personal info About half of all the blogs on the Internet are authored by teenagers, according to a 2003 study by the Perseus Development Corp. (a web survey software provider); and a majority of the top 15 sites visited by teens 17 and under in January of 2005 were either blogs or social networking sites, according to comScore Media Metrix (an Internet audience profiler). A study of teenage blogs published by the Children’s Digital Media Center at Georgetown University revealed that two-thirds of teenage bloggers provide their age and first name; 60 percent offer their location and contact information; and one in five divulge their full name on their sites. Source: http://www.tahoebonanza.com/article/20051026/News/110260007
Average American Family TV Viewing (Nielsen Survey, Sept. 2005) September 2004 to September 2005 September 2003 to September 2004 September 1994 to September 1995 7 hours 15 minutes
8 hours 11 minutes 8 hours 1 minute Source: http://www.adage.com/news.cms?newsId=46225 See also: Nielsen Reports Americans Watch TV at Record Levels
Ball State University Middletown Media Studies 2 (Sept.26. 2005) Here are the overall amounts of media minutes spent per user per day according to the 5,000 hours of observations recorded by the project researchers:
-
-
-
-
-
-
- Television: 240.9 minutes
-
-
-
-
-
-
- American Kids Study 2005 Gaming is the top online activity. CD players outnumber MP3 players for music listening 70% want to make a lot of money when they are older. When asked what they do when TV commercials come on, nearly 60% of respondents say they watch them. Source: http://www.mediamark.com/mri/docs/press.html More from this study: more than half said they listen to music on CD players more than MP3 players, and that most (74%) listened to music most often on car radios. Surprising to me, only 4.1% said they listen on an MP3 player, though I’m sure this number is going up as MP3 players get cheaper and cheaper. Source: http://www.businessweek.com/the_thread/brandnewday/archives/2006/01/kids_dont_skip.html
-
-
-
-
-
-
-
- Any computer use: 135.8 minutes
-
-
-
-
-
-
-
- All Internet: 93.4 minutes
-
-
-
-
-
-
-
- Radio: 80.0 minutes
-
-
-
-
-
-
-
- Music [includes MP3 players]: 65.1 minutes
-
-
-
-
-
-
-
- Phone, includes cell: 42.2 minutes
-
-
-
-
-
-
-
- All print media: 32.8 minutes
-
-
-
-
-
-
-
- All video [VCR and DVD]: 32.6 minutes
-
-
-
-
-
-
-
- Newspapers: 12.2 minutes
-
-
-
-
-
-
-
- Game console: 11.6 minutes (Source: http://www.poynter.org/content/content_view.asp?id=89510)
Of all the adults studied, researchers determined that about:• 91 percent watched television, for an average of nearly 241 minutes a day, and mostly at home.• 73 percent listened to the radio, for an average of 80 minutes a day, more in the car than at home or work, but home-and-work listening combined was a higher percentage of usage than in-car listening.• 73 percent used a computer, for an average of nearly 136 minutes a day, more at work than at home.• 63 percent read newspapers, books or magazines, averaging nearly 33 minutes a day, mostly at home, but a sizable number did so at work or other locations.• 59 percent used mobile phones, more at work than any other location, for an average of nearly 11 minutes, and 32 percent used a variety of video products, mostly at home, for an average of nearly 33 minutes.
- Game console: 11.6 minutes (Source: http://www.poynter.org/content/content_view.asp?id=89510)
-
-
-
-
Young Children’s TV Viewing Nielsen Media Research estimates that there are 15.9 million children aged 2 to 5, and Nielsen figures show that the children watched an average of 3 hours and 40 minutes of television a day during the 2004-5 TV season – 13 minutes more than the 2000-1 season. (Source: http://www.nytimes.com/2005/09/26/business/media/26kids.html)
Internet consumption twice as high as magazines and newspapers During a typical week, the Forrester Research respondents were found to spend around 10 hours per week on a PC, with 6 hours actively spent browsing the Internet compared to 13 hours watching TV, 7 hours listening to the radio, 3.4 hours reading newspapers and 2.4 hours reading magazines. Source: http://www.ameinfo.com/66525.html Internet Use by Kids & Teens (September 2005) eMarketer’s new report, “Kids & Teens: Blurring the Line between Online and Offline,” says kids and teens make up 19% of all US Internet users. That’s some 18.8 million teens and another 14.1 million children. About 73% of teens ages 12-17 and 39% of children ages 3-11 are online regularly. http://biz.yahoo.com/iw/050907/094702.html
RADIO Paragon Media Strategies has released a study that says radio is still the primary music-listening source for 51% of its respondents, age 18 to 64. Purchased CDs are second, at 30%. Forty-eight percent said radio is their primary source for hearing new music.
Gamers’ TV time going down the tube http://www.usatoday.com/printedition/life/20050809/d_lline09.art.htm If video killed the radio star in the 1980s, then it seems video games are trying to do the same thing to TV in this decade, according to the Digital Gaming in America survey released Aug.9 by Ziff Davis Media. The study noted that 24% of gamers reduced their TV watching over the past year and 18% expect to cut small-screen viewership next year. Video gamers watched 11.1% less TV than last year, dropping their weekly TV viewership to 16 hours, compared with 18 hours in 2004. The gaming population showed an 11.4% increase to 76.2 million video gamers this year, compared with 67.5 million a year ago.
There are 76.2 million game-playing households in the U.S. in 2005 — up 11.4% from 67.5 million in 2004. Source: http://www.adage.com/news.cms?newsId=45987
WHAT TEENS DO ONLINE The percentage of U.S. Internet users, ages 12-17, who do the following online: 89% – Send or read e-mail 84% – Go to Web sites about movies, TV shows, music groups, sports 81% – Play online games 76% – Go online to get news or information about current events 75% – Send or receive instant messages 57% – Go online to get information about college 43% – Buy online merchandise 22% – Look for information about a health topic that’s hard to talk about SOURCE: Pew Internet & American Life Project (July 27,2005)
MULTI-TASKING WHILE CONSUMING MEDIA The latest Simultaneous Media Survey from BIGresearch details a new hurdle for advertisers, multitasking, the engagement in other non-media activities while consuming media, and the numbers are large. According to Joe Pilotta, VP of Research, BIGresearch, “The complexities of everyday life seem to be increasing, and as a result consumers are multitasking as a way of coping.”The 25-34 year olds are most likely to engage in multi-tasking, says the report, when using electronic media (TV, Radio, Internet) with almost 70% saying they do so regularly or occasionally. The 55+ age group multitasks the least but like the 25-34 year olds are most likely to do so when using electronic media, 60% say they multitask regularly or occasionally using TV. Multitaskers 69.3% 69.0% 68.1% 49.5% 40.9% 40.2%
Multi-Tasking While Consuming Media by Jack Loechner, Tuesday, Jul 5, 2005 3:00 AM EST Online Radio TV Mail Newspaper Magazine Source: BIGresearch, June 2005
The percent of people 18+ who say they multitask while using various media’s “It’s apparent that multitasking and simultaneous media consumption creates competition for the same time and space. Media may be relegated to the background when consumers multitask e.g. talking on the phone. When they simultaneously consume media, one of the media can morph into the background and back to the foreground intermittently. That is why understanding which media have the greatest influence on purchasing various merchandise categories becomes a key determinant for marketing ROI in today’s complex media environment,” said Pilotta. Find out more here. Center for Media Research
RADIO According to Road and Marketing Fact Book 2003, more than 75 percent of the U.S. population age 12 and older listens to radio daily and 94 percent tune in on a weekly basis. Source: http://www.detnews.com/2005/autosconsumer/0507/11/G01-231075.htm
CABLE AUDIENCE AGE Oldest audiences Cable Net Media Age
Youngest audiences Cable Net Median Age 15.4 19.7 20.2 21.5 26.2 28.1 30.1 35.2 37.1 37.4 MTV2MTVBETVH1ComedyABC FamilyTBSFX Nick at Nite Fuse Source: USA Today www.usatoday.com/ printedition/ life/20050707/ d_nielspotlight07.art.htm
61.8 61.2 58.5 57.5 57.2 56.6 56.1 53.9 53.7 53.4 HallmarkMSNBCBiographyGame ShowHeadlineBBC AmericaTV LandHGTV
Fox News CNN
Demographic estimates within U.S. TV households include: 2000-20012001-20022002-2003 102,200,000105,500,000106,700,000 261,780,000269,880,000272,040,000 103,780,000107,070,000108,190,000 95,490,00098,560,00099,020,000 22,660,00023,520,00024,840,000 39,850,00040,730,00039,990,000 Persons 2+Women 18+Men 18+Teens 12-17Children 2-11
Demographic Households Source: http://www.psaresearch.com/newnewsletter/goodwillnov02.asp
Read NY Times story accompanying this graphic

Media Report to Women- Industry Statistics
MONITORING KIDS ONLINE ACTIVITY May 23, 2005–A new survey commissioned by the National Center for Missing & Exploited Children(R) (NCMEC) and Cox Communications reveals that, while nearly half of the parents surveyed monitor their children’s online activity daily or weekly, the other half admit they don’t even know that such monitoring tools are available. The results are a compelling backdrop for Internet Safety Month in June. Other key findings: — Over half (51%) of parents either do not have or do not know if they have software on their computer(s) that monitors where their teenager(s) go online and with whom they interact. — 42% of parents do not review the content of what their teenager(s) read and/or type in chat rooms or via instant messaging. — Teenagers who Instant Message use chat lingo to communicate and parents don’t know the meanings of some of the most commonly used phrases. 57% don’t know LOL (Laughing Out Loud), 68% don’t know BRB (Be Right Back), and 92% don’t know A/S/L (Age/Sex/Location). — 95% of parents couldn’t identify common chat room lingo that teenagers use to warn people they’re chatting with that their parents are watching. Those phrases are POS (Parent Over Shoulder) and P911 (Parent Alert). — Nearly three out of 10 (28%) of parents don’t know or are not sure if their teens talk to strangers online. — 30% of parents allow their teenagers to use the computer in private areas of the house such as a bedroom or a home office. Parents say they are more vigilant about where their teen(s) go online if the computer is in a public area of the household. — 58% of parents surveyed say they review the content of what their teenager(s) read and/or type in chat rooms or via Instant Messaging; 42% do not. Complete survey results at: www.cox.com/TakeCharge
AUDIENCE DECLINE OF THE BIG 3 TV NETWORKS
 from WSJ story, 5/23/05
TIME SPENT IN FRONT OF TV …actual hours in front of the tube vary considerably. College-educated workers spend 1.4 hours a day — 6% of their 24 hours — watching TV. Consumers with a high-school diploma but no job spend four hours a day — 17% of their existence — watching the small screen. The study, based on 2003 data, found that Americans spend 11% of their life in front of a TV screen. (excerpt from Bureau of Labor Statistics report on how Americans spend their time… reported on Advertising Age web site: http://www.adage.com/news.cms?newsId=44895)
VIDEO GAMES About 70 percent of males age 18 to 34 play video games and spend less time consuming other media. According to Nielsen Interactive Entertainment, people who see ads in games recall them better. In 2003, Nielsen said that males in this age group played 30 billion hours of games, as much time as they spent watching TV. And much of the playing occurred during prime time TV hours. Source:http://www.mercurynews.com/mld/mercurynews/11364926.htm
MEDIA HABITS: KIDS AGE 8-18 Kids media habits Kaiser Family Foundation (March 9) releases ” Generation M: Media in the Lives of 8-18 Year-olds”
Teens spend 90 minutes a day online: LOS ANGELES, March 2 : Some teenagers spend more than 90 minutes every day instant messaging and e-mailing their friends and downloading music online, researchers said Wednesday. The most frequently cited reasons for instant messaging are to “hang out” with friends and relieve boredom, Children’s Digital Media researchers said. The most common topics are friends and gossip. “The Internet appears to serve social functions similar to the telephone’s,” researcher Elisheva Gross said. The study examined the online habits of 200 12- to 15-year-old suburban California students. It found students spend an average 40 minutes a day instant messaging friends, 31.4 minutes downloading music and 22 minutes sending and reading e-mail. The study, reported in a special issue of the Journal of Applied Developmental Psychology, was funded by the National Science Foundation, – — Copyright 2005 by United Press International.
Electronic Media & The Family This paper examines media messages and media experiences in the context of the family.
Video Game Demographics The Entertainment Software Association released the latest stats on the video gaming industry. Some key findings:
-
-
-
-
-
-
- 34% of people under the age of 18 play computer or video games; 46% of 18-50 year-olds
-
-
-
-
-
-
-
-
-
-
- The top selling video game genres: 27.1% action, 17.6% sports, 11.3% racing, 8.7% role-playing, 8.6% first-person shooters, 6.9% fighting and 4.7% family entertainment.
-
-
-
-
-
-
-
-
-
- Ratings game: 30.5% of computer and video game sales in 2003 were for “T” rated games (13+ years of age); up from 27.6% in 2002. “M” rated (17+ years of age) game sales dropped to 11.9% in 2003 from 13.2% in 2002. “E” rated (all ages) games dropped to 54.0% in 2003 from 55.7% in 2002. http://www.theesa.com/EFBrochure.pdf (9 page pdf file) See also: Video games crowding out TV and movies http://www.theesa.com/5_12_2004.html See also: Media consumption study http://www.bsu.edu/news/article/0,,18107–,00.html See also: Boys prefer video games to toys http://www.npdfunworld.com/funServlet?nextpage=news_article.html&nwsid=6384
-
-
-
-
TV’s Still The ‘Greatest,’ But Digital Technology Is Altering Media Preferences By Joe Mandese Editor, MediaPost http://www.mediapost.com/dtls_dsp_news.cfm?newsID=277407 Monday, November 08, 2004
For
all the incursions of new digital media, television remains the
“greatest” overallmedia experience among consumers by a margin of nearly two-to-one over the
nextmost dominant medium, the Internet. But asked, which medium they
“prefer” the most,more consumers would choose the Internet. These are among the key findings
of anew study of consumer preferences for media conducted recently by
InsightExpress.The research also found that
while TV still is the first medium Americans “turn to” andthe one they consider “easiest to use,” they consider the
Internet to be the one that ismost “informative,” and perhaps more importantly, the one that
offers the “greatest control.”Preferred Over All Others
TV              39%

Magazines      2%

Newspapers    8%

Internet        40%

Radio            4%

All Are Equal   12%

Source: InsightExpress. Base = 500 people surveyed online on Sept. 17, 2004.
The findings show that all
other media – including magazines, newspapers and radio – pale in
comparisonwith TV and the Internet. They also reveal that the next generation of
digital media technologies may betipping the hand in favor of the Internet.
Among households with
digital video recorders – a technology that ostensibly would seem to give
consumersmore control over and satisfaction with television – respondents were even
more disposed toward the Internet.While 42 percent of non-DVR
owners cited TV as the first medium they “turn to,” only 33
percent of DVR ownerscited it. Conversely, a greater number (40 percent) of DVR owners said
they turn to the Internet first than non-DVRowners (33 percent).
While the study did not
break out how other new media technologies are impacting consumer media
preferencesper se, Lee Smith, president-COO of InsightExpress, said some might also
be tilting preferences in favor of the Internet.“My but as a researcher
is that broadband households would be slightly more favorable about the
Internet,” he said.“What this is telling
us is that people value control. They value the information content on the
Internet and I thinkit’s only a matter of time before the broadband capacity of the Internet
catches up and drives the entertainment valueof the Internet making it more competitive with television.”
Consumer Preferences By
Media AttributeProvides Is The Gives Me Is The Is the Greatest Most Greatest First I Easiest Experience Informative Control Turn On To Use TV 46% 20% 22% 40% 42% Magazines 3% 5% 3% 1% 3% Newspapers 3% 23% 9% 12% 7% Internet 27% 37% 49% 34% 24% Radio 3% 4% 2% 9% 7% All Are Equal 18% 11% 15% 5% 17%Source: InsightExpress. Base = 500 people surveyed online on Sept. 17,
2004.
Read Gallup
Poll (Oct.2004) on Teen Leisure Habits: TV Still On Top———————————————————————————————————————————
A new brief by the Kaiser Family
Foundation finds that while more students fromincomes and backgrounds are using computers and the Internet,
disparities continueto exist in the quality of access (broadband versus dial-up, for
example) and in thenature of the activities and work students are engaged in online.
The thought-provoking report “Children, the Digital Divide, and
Federal Policy”is available online at http://www.kff.org/entmedia/entmedia091604pkg.cfm
These days teenagers (33 million of them
in 2003, according to the U.S. Census Bureau)and technology are a powerful mix. According to a 2003 study from the
ConsumerElectronics Association, 84 percent of teens ages 13-17 strongly agree
that newtechnology gives them access to information that improves their life, 75
percent enjoythe challenge of figuring out high-tech gadgets and 55 percent says
electronic gadgetsallow them to make a statement about who they are.
Quoted in: AdWeek (July 2004)http://www.adweek.com/aw/regional/southwest/article_display.jsp?vnu_content_id=1000575212


Both charts above from: http://www.economist.com/business/PrinterFriendly.cfm?Story_ID=2787854
Three
Out of Four Americans Have Access to the Internet (March 2004)
U.S. Sen. Fritz Hollings, D-S.C., spoke at length
last week (Feb.2004) about protectingchildren from violent and indecent
programming. Here are some numbers he presentedto back up his case:
8,000 Number of TV murders the average child will witness before
completing elementary school100,000 Number of acts of violence on TV the average child will witness
before completing elementary school300 Number of studies demonstrating a link between media violence and
violent, aggressive, anti-social behavior in children9% Portion of parents of children aged 2-17 who own a TV with a
V-chip39% Portion of parents of children aged 2-17 that have never heard of the
V-chip79% Portion of TV shows containing violence that did not receive the
appropriate “V” ratingSOURCES: Congressional Research Service, Kaiser Family Foundation surveys
——————————————————————————————————————————————————————————–
Children’s Bedrooms Are Media Havens –
Almost Two-Thirds Have a TV, 17% a PC; Significant Effects Seen on Media
HabitsKnowledge Networks/SRI study shows that kids with own-room
technologiescombine media more often, have less supervision
Menlo Park, CA; October 6, 2003:
According to a just-released Knowledge Networks/SRI study,almost
two-thirds (61%) of children now have a television set in their bedrooms,
17% have theirown PC – and own-room access to such media technologies is
linked to substantial changes in how kids use media.The new report, “How Children Use™
Media Technology,” is part of the ongoing service“The Home
Technology Monitor™,” which combines semi-annual nationwide
surveys of media technologyownership with special reports on key devices
and services. These special reports are usually basedon Knowledge
Networks/SRI’s exclusive “How People Use®” media
methodology, a proventechnique for studying the quality of media
exposures.Based on interviews with 245 children ages
8 to 17, the new study also shows that 35% of kidshave videogame systems
in their rooms, 14% have their own DVD player, and 9% have Internetaccess
via a PC in their bedrooms. And the presence of these technologies
correlates withsignificant changes in media behavior; for example, among
children with an own-room television:-
46% do at least half of their TV viewing
on that set; -
75% report multitasking while watching
TV (vs. 65% of kids without their own sets); -
43% have visited a Web site as the
result of a TV ad within the past week(vs. 24% of kids without their
own TVs); and -
50% say they have parental rules for
their TV use (vs. 61% of kids without their own sets).
The relatively few kids with own-room
Internet access also report substantial effects on their media use:-
57% say all of their Internet use takes
place in their rooms; and -
61% report having parental rules
restricting their Web use, compared to 69% ofInternet-using kids who
do not have own-room Web connections.
Study:
Baby boomers are still fond of traditional methods in high tech age
Internet Use Annual Report ( UCLA Center for Communication Policy)http://ccp.ucla.edu/pages/internet-report.asp
MEDIA
MULTI-TASKING (NOV. 2002)Americans have become well known for
their ability to multi-task. A new study, by BIGresearch,has found that Americans have begun multi-tasking in a new arena – media.
The study, which measuressimultaneous media usage (when consumers use a primary media source while
a secondary source is in use),may change how marketers reach their target audiences. According to
the Simultaneous Media Usage Study,roughly half of consumers engage in simultaneous media usage.
Study results included information such
as:- 69% of males and 76% of females have
the TV on while online - 51% of males and 52% of females read
magazines when they have the radio on - 53% of males and 59% of females watch
TV when they read the newspaper - 50% of males and 60% of females watch
TV when they read magazines - 67% of males and 74% of females read
the newspaper while they have the TV onSOURCE: http://www.psaresearch.com/newnewsletter/goodwillnov02.asp
-
Recent
Industry Research: Simultaneous Media Usage (provided by PBS)
In
today’s world, consumers live in a networked, interactive, and multi-media
environment.
Simultaneous media usage is a reality for approximately
50% of the population.
What is simultaneous media? People using
various types of media – – such as the TV
and computer — simultaneously.
The
Simultaneous Media Usage Study (SIMM) Survey, published twice annually by
BIGresearch, quantifies how the public consumes multiple media. The latest
survey,
conducted from March 25 to April 22, 2003, included data from
12,230 respondents.
Some
of the findings show that:
-
33%
of males and 36% of females regularly watch TV while they are
online·
24%
of males and 29% of females regularly go online when they are watching TV·17%
of males and 22% of females regularly watch TV when they read the mail
When
asked what they do when a television commercial come on:
-
15%
of the population regularly leave the room·30%
mentally tune out·30%
regularly watch, but not with full attention·31%
regularly channel surf·32%
regularly talk with others in the room or on the phone
US youngsters
hooked on to Net, TV say researchers
Indiantelevision.com
Team
(16 August
2003 )
NEW YORK: Most teenagers and young adults in the
US prefer surfing the Internet or
watching television over reading for
recreation, the US-based Centre for Media Research
quoted from an
eMarketer report recently.
The report stated that Harris Interactive and
Teenage Research Unlimited surveyed
2,618 people in the age group of 13 to
24 in June, and found that respondents spend
twice as much time per week
watching TV as reading books or magazines for pleasure.
The survey, done for Yahoo! and Carat, gave the
following figures:
|
Activity |
Hours per week |
|
Internet surfing |
16.7 |
|
Watching TV |
13.6 |
|
Radio |
12 |
|
Talking on phone |
7.7 |
|
Reading books/magazines |
6 |
The survey said that the main reason cited among
respondents for spending so much time
online was the quality of
“control” the Internet affords users. Users can personalize and
manage their experience online more so than with any other form of media.
As for the type of website most in demand, teens
between the ages of 12 and 17 spend
an average of 26.6 minutes each day
with instant messaging (IM) applications,
24.4 minutes per day with game
sites and a whopping 41.5 minutes per day on sites
with some sort of
corporate presence, comScore Media Metrix determined at the end of 2002.
eMarketer stated that by the end of 2003, roughly
17 per cent of US Internet users
will be in nine to 17 age group and about
29 per cent in the 18 and 34 age group.
Born to Be Wired:
Understanding the First Wired Generation
36 page report (July 2003) http://us.i1.yimg.com/us.yimg.com/i/promo/btbw_2003/btbw_execsum.pdf
———————————————————————————–
from the September 2002 issue of Better Homes & Gardens
magazine, page 250
When it comes to their daily does of media, boys and girls have slightly
different appetites,
reports the Kaiser
Family Foundation.
-
boys watch television an average 2 hours 56 minutes a
day; slightly more than girl’saverage of 2 hours 36 minutes.
-
Between
the ages of 10 and 17, boys are more likely to watch TV daily than aregirls
(81 percent vs. 75 percent), reports Children
Now, a California group that tracks media usage. -
boys are more likely to watch sports and cartoons,
while girls are more likely tocheck out talk shows. They share a love for
music videos:49 percent of kids say they watch these daily
-
boys spend just over a half an hour a day playing
video games, while girls play only8 minutes a day. And on a typical day,
one out of every four boys will play an actiongame, such as Doom or Duke
Nukem. -
Girls spend more time than boys listening to CDs and
tapes (56 minutes per day vs. 41 minutes);and listening to the radio (42
minutes vs. 36 minutes)
————————————————————————————————————————–
Source for this graphic: http://www.ncrel.org/engauge/skills/growup.htm

Information presented
in the above exhibit was found in two sources:
Corporation for Public Broadcasting. (2003).
Connected to the future: A report on children’s Internet use. Retrieved April 7,
2003, from http://www.cpb.org/ed/resources/connected/.
Grunwald Associates. (2000). Children,
families, and the Internet. Burlingame, CA: Author.
—————————————————————————————————————–
Television
viewing:
Children
aged 2-5 average 25 hours per week watching TV.
Source: AC Nielsen Co., 1990
Children
aged 6-11 average more than 22 hours per week watching TV.
Source: AC Nielsen Co., 1990
Children
aged 12-17 average 23 hours per week watching TV.
Source: AC Nielsen Co., 1990
30%
of middle-aged men (median age in the study was 39.5) watch TV 3 or more
hours
per day, while another 61% watch TV 1-2 hours per day.
Source: 1989 study by Larry Tucker at
Brigham Young University
.
“By the time most Americans are 18 years old, they have spent more time in
front
of the television set than they have spent in school, and far more than
they have
spent talking with their teachers, their friends or even their
parents.”
Quote from Abandoned in the Wasteland:
Children, Television and the First Amendment,
by Newton Minnow, former Chairman
of the FCC, and Craig LaMay, 1995
“By
first grade, most children have spent the equivalent of three school years in
front of the TV set.”
Quote from Abandoned in the Wasteland:
Children, Television and the First Amendment, by
Newton Minnow, former Chairman
of the FCC, and Craig LaMay, 1995
.
62% of fourth graders say they spend more than three hours per day watching TV.
Source: Educational Testing Service study,
1990
64%
of eighth graders report watching more than three hours of TV per day.
Source: Educational Testing Service study,
1990
.
By the time today’s child reaches age 70, he or she will have spent
approximately seven years watching TV.
Source:
American Academy of Pediatrics study, 1990
———————————————————————————————————————————————————————–
More sources for detailed information on media usage:
Children,
Adolescents, and Television This American Academy of Pediatrics policy
statement explores children’s TV viewing habits and the potential health hazards
of too much TV time.
Children Now Diversity,
Gender studies
Children’s
Programming Survey by the Annenberg Public Policy Center
Internet and the
Family by the Annenberg Public Policy Center
Kaiser Family Foundation Kids
& Media at the New Millenium
Children
& Video Games Survey
on Teens, Sex & TV 2003
Sex on TV Story
Media In The Home National Survey by the Annenberg Public Policy Center
Mediascope– raising
awareness about media and society
National Institute
on Media & The Family– helping families and educators maximize
the
benefits and minimize the harm of mass media on children through research,
education and advocacy
Quick
Facts: Media Awareness Network
TV Turnoff
Network-facts and figures
Recommended Texts
|
Publisher: Sage ISBN: 0761921257; (March 2002)
|
The Penguin Atlas of Media & Information Format: Paperback, 128pp. ISBN: 0142000175 Publisher: Penguin USA |
Publisher: Sage Publications; ISBN:
|


——————————————————————————————————————————————————————————————————————————————————
NEW STUDY FINDS KIDS SPEND EQUIVALENT OF
FULL WORK WEEK USING MEDIA
Many
Kids Have Multi-Media Bedrooms, TV on During Dinner, and No Rules
Time
Spent With Computers Lags Far Behind TV and Music
New York, NY – The typical American child spends an average of more than 38
hours a week – nearly five and a half hours a day (5:29) – consuming media
outside of school, according to a major national study released today by the
Kaiser Family Foundation. That amount is even higher – nearly six and
three-quarter hours a day (6:43) – for kids eight and older. The study – Kids
& Media @ The New Millennium – examined media use among a nationally
representative sample of more than 3,000 children ages 2-18, including more than
600 who completed detailed media use diaries. The study included children’s use
of television, computers, video games, movies, music and print media.
“Watching TV, playing video games, listening to music and surfing the
Internet have become a full-time job for the typical American child,” said
Drew Altman, Ph.D., president of the Kaiser Family Foundation. “This
study really underscores the importance of paying attention to the messages and
the information kids are getting from the media, both good and bad.”
The study also found that many parents are not exercising much control over
their children’s media use: among kids eight and older, two-thirds
(65%) have a TV in their bedroom and say the TV is usually on during meals in
their home, and nearly that many (61%) say their parents have set no rules about
TV watching. Parents watch TV with their kids in this age range
just 5% of the time. Nearly one out of every four kids in this age
group (24%) spends more than five hours a day watching TV.
Even the youngest kids are dedicating a big chunk of their day to media use. According
to their parents, kids in the 2-7 year-old age range spend an average of three
and a half hours a day using media. Even among these younger kids,
one in three (32%) has a TV in their bedroom. More than a third (35%)
of parents of 2-7 year-olds say the TV is on in their homes “most of the
time” and almost half (47%) say it is usually on during meals. Parents
watch TV with their young kids just 19% of the time.
Computers. Nearly seven in ten kids (69%) have a computer at
home and nearly half (45%) have Internet access from home. Among kids
eight and older, one in five (21%) has a computer in their bedroom. But
despite this widespread access to computers, kids still spend a comparatively
small amount of time with computers, averaging less than half an hour a day
(:21) using a computer for fun, compared to two and three quarters hours a day
(2:46) watching TV. “Computers may be the wave of the future, but TV still
dominates kids’ time and attention today,” said Vicky Rideout, director of
the Foundation’s Program on the Entertainment Media and Public Health.
There are significant disparities in computer use among children from different
economic circumstances: in a typical day, half (50%) of all kids who
live in or go to school in higher income communities use a computer, while only
29% of those from lower income areas do. Schools are helping
bridge that gap: students are equally likely to use a computer in
class whether they go to school in a low (32%) or a higher income (30%)
community.
Contrary to popular perception, the study did not find evidence of large numbers
of children spending hours a day playing computer games or surfing the Internet. Less
than one in ten kids (9%) spends more than an hour a day using a computer for
fun, including 3% who spend more than an hour online and 2% who spend more than
an hour playing computer games. By contrast, nearly two-thirds of
kids (64%) spend more than an hour a day — and 17% spend more than five
hours a day — watching TV.
“Heavy” media users. The study identified a subset
of children in the 8-18 year-old range who are classified as “heavy”
media users – those who spend more than ten and a half hours a day using media. About
one in six kids (16%) falls into this category.
Most kids in this age group report that they have lots of friends, are happy at
school, get along well with their parents, don’t get into trouble a lot, and are
not often bored, sad or unhappy. On a “contentedness index”
summarizing self-reports on these issues, most children appear well-adjusted. However,
those children identified by the study as “heavy” media users score
lower on the index than those children who use less media. The study
cannot determine whether heavy use of media causes kids to be less content,
whether discontent contributes to children spending more time with media, or
whether some other factors cause both effects. However, even when
controlling for factors such as race, age, family composition and income of the
community in which the child attends school, indicators of discontent are
associated with high media use.
Other media. According to the study, music is a dominant force
in kids’ lives. Young people spend an average of almost an hour and a
half a day (1:27) listening to CDs, tapes or the radio. “After
TV, music is the medium of choice for most kids, especially older teens,”
said Donald F. Roberts, Jr., Ph.D., professor of communication at Stanford
University and an author of the study.
While the study confirms that electronic media dominate young people’s time, it
also indicates that reading for pleasure is still a staple in most kids’ lives. More
than eight in 10 kids (82%) will read for fun each day, averaging nearly three
quarters of an hour (:44) a day (excluding time spent reading in school or for
homework). But kids still spend more than five times as much time in front of a
TV, computer or video game screen each day than they do reading (4:06 v. :44).
Methodology: The study is based on a nationally representative
sample of 3,155 children ages 2-18, including more than 2,000 written
questionnaires completed by children 8 and older, more than 1,000 in-home
interviews with parents of 2-7 year-olds, and more than 600 week-long media use
diaries maintained by parents (for 2-7 year olds) or kids (for 8-18 year-olds). The
surveys and diaries were completed between November 10, 1998 and April 20, 1999. The
study was designed by Kaiser Family Foundation staff in consultation with
Stanford University Professor Donald F. Roberts, Jr. and Harris Interactive,
Inc. (formerly Louis Harris & Associates). The data were
collected by Harris Interactive, and the results were analyzed by Foundation
staff and Professor Roberts. The margin of error for the combined
sample of children 2-18 is +/- 3%; for children 8 and older it is +/- 3%; and
for children 2-7 it is +/- 5%. The study e xamines children’s
non-school use of television, videos, movies, video games, CDs and tapes, radio,
books, magazines, newspapers and computers. Children or parents
completed detailed questionnaires regarding the child’s use of these media the
previous day.
The Kaiser Family Foundation, based in Menlo Park, California, is an
independent national health care philanthropy, and is not affiliated with Kaiser
Permanente or Kaiser Industries. This study is a project of the
Foundation’s Program on the Entertainment Media & Public Health,
which was established to examine the impact of entertainment media on society,
and to work with the entertainment industry on important public health issues.
To order a copy of the full study (publication #1536), executive summary
(#1535), or appendices (#1537) on which this release is based, call the Kaiser
Family Foundation’s publication request line at 800-656-4533, or review them
online at www.kff.org.
# # #
Kids
& Media @ the New Millennium:
A Kaiser Family Foundation Report
Key Data
Amount of time children spend using media each day, on average:1
All kids 2-18 5:29
2-7 year-olds 3:34
8 and older 6:43
Amount of time kids spend each day, on average:2
Watching TV
2:46
Listening to music 1:27
Reading for fun :44
Watching videos :39
Using a computer for fun :21
Playing video games :20
Online
:08
Percent of kids who spend more than an hour a day:
Watching TV
64%
Reading for pleasure 20%
Listening to CDs or tapes 19%
Listening to the radio 17%
Using a computer for fun 9%
Playing video games
8%
Online
3%
Playing computer games 2%
Amount of time kids spend each week, on average:3
Watching TV
19:19
Listening to music 10:04
Reading
5:15
Using a computer for fun 2:29
Playing video games 2:17
Percent of kids who have a TV in their bedroom:
All kids 2-18 53%
2-7 year-olds 32%
8 and older
65%
Percent of kids who use a computer in a day:
All kids 2-18 42%
2-7 year-olds 26%
8 and older
51%
Percent of kids who have a computer in the home:
All kids 2-18 69%
2-7 year-olds 62%
8 and older 73%
Lower income4
49%
Upper income 81%
Percent of kids who have a computer in their bedroom:
All kids 2-18 16%
2-7 year-olds 6%
8 and older 21%
Percent of school-aged children who use a computer in a typical day, by
income:4
In school:
Lower income 32%
Upper income 30%
Out of school:
Lower income 23%
Upper income 48%
Parental oversight:
Percent of kids…
With no rules about TV: 49%
In homes where TV is
usually on during meals: 58%
Percent of time parents watch TV with their kids:5
2-7 year-olds: 19%
8-18 year-olds: 5%
Time is presented in hours:minutes.
Times cannot be summed, due to use of more than one medium at a time.
Week-long averages are based on mean times with each medium, separating out
weekday and weekend reports. Times cannot be summed due use of more than one
medium at a time.
Income categories are based on the median income of the zip code in which the
child lives (for 2-7 year-olds) or goes to school (for 8-18 year-olds), and
represents the following ranges: “low income” is less than $25,000,
and “high income” is $40,000 or more.
Based on media-use diaries.
Share This Page: